29
/
en
AIzaSyAYiBZKx7MnpbEhh9jyipgxe19OcubqV5w
April 1, 2024
32334
Europe & Central Asia (excluding high income)
ECA
false
2
1
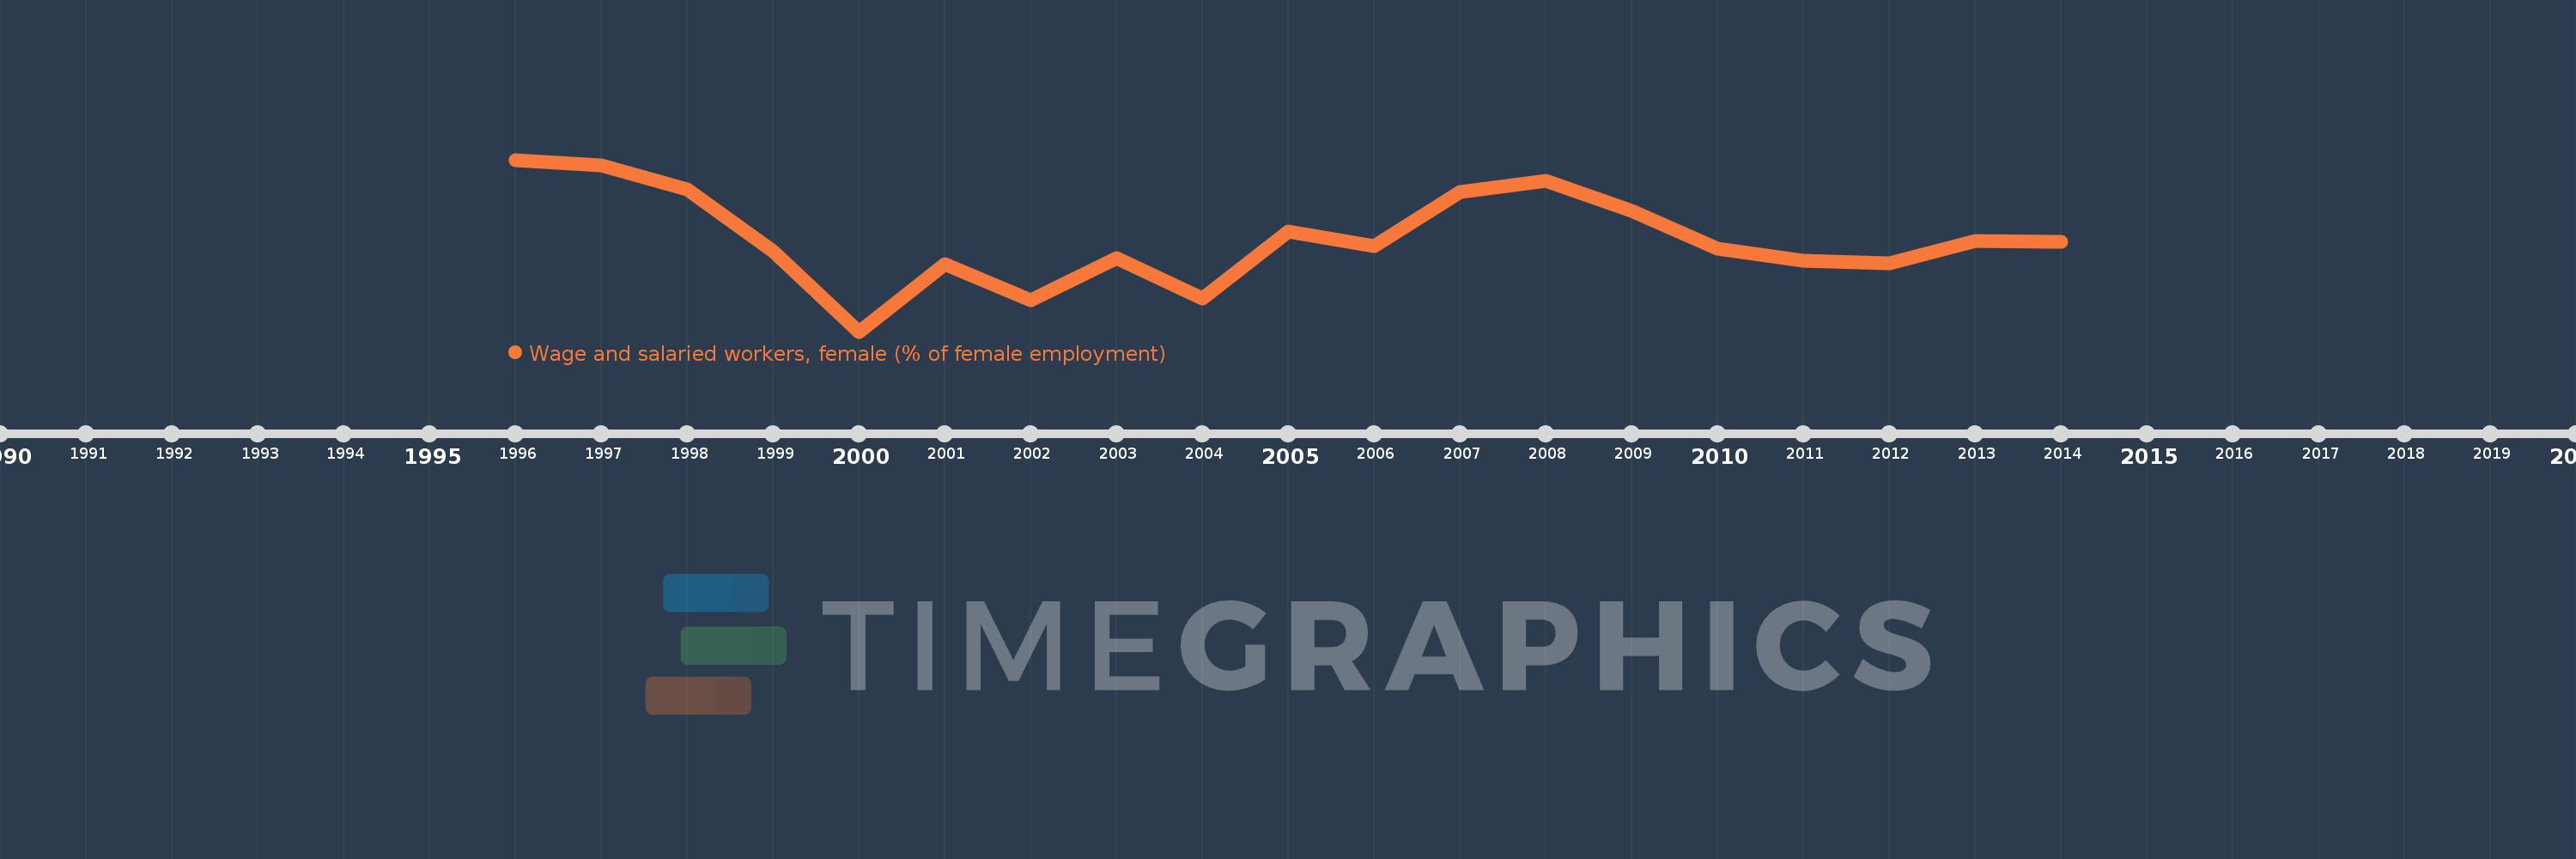
Wage and salaried workers, female (% of female employment)
2014,2013,2012,2011,2010,2009,2008,2007,2006,2005,2004,2003,2002,2001,2000,1999,1998,1997,1996
This statistics in other country:
AlbaniaAlgeriaAmerican SamoaAntigua and BarbudaArgentinaArmeniaArubaAustraliaAustriaAzerbaijanBahamas, TheBahrainBangladeshBarbadosBelarusBelgiumBelizeBeninBermudaBhutanBoliviaBosnia and HerzegovinaBotswanaBrazilBritish Virgin IslandsBrunei DarussalamBulgariaBurkina FasoBurundiCabo VerdeCambodiaCameroonCanadaCaribbean small statesCayman IslandsCentral Europe and the BalticsChadChileColombiaCongo, Rep.Costa RicaCote d'IvoireCroatiaCubaCyprusCzech RepublicDenmarkDjiboutiDominicaDominican RepublicEarly-demographic dividendEcuadorEgypt, Arab Rep.El SalvadorEquatorial GuineaEstoniaEthiopiaEuro areaEurope & Central AsiaEurope & Central Asia (excluding high income)Europe & Central Asia (IDA & IBRD countries)European UnionFijiFinlandFranceFrench PolynesiaGabonGambia, TheGeorgiaGermanyGhanaGreeceGrenadaGuatemalaGuineaGuyanaHaitiHigh incomeHondurasHong Kong SAR, ChinaHungaryIcelandIndiaIndonesiaIran, Islamic Rep.IrelandIsle of ManIsraelItalyJamaicaJapanJordanKazakhstanKenyaKiribatiKorea, Rep.KosovoKuwaitKyrgyz RepublicLao PDRLatin America & Caribbean Latin America & Caribbean (excluding high income)Latin America & the Caribbean (IDA & IBRD countries)LatviaLebanonLesothoLiberiaLithuaniaLower middle incomeLuxembourgMacao SAR, ChinaMacedonia, FYRMadagascarMalawiMalaysiaMaldivesMaliMaltaMarshall IslandsMauritiusMexicoMiddle East & North AfricaMiddle East & North Africa (excluding high income)Middle East & North Africa (IDA & IBRD countries)MoldovaMongoliaMontenegroMoroccoMozambiqueNamibiaNepalNetherlandsNew CaledoniaNew ZealandNicaraguaNigerNorth AmericaNorwayOECD membersOmanPakistanPanamaParaguayPeruPhilippinesPolandPortugalPost-demographic dividendPuerto RicoQatarRomaniaRussian FederationRwandaSamoaSan MarinoSao Tome and PrincipeSaudi ArabiaSenegalSerbiaSeychellesSierra LeoneSingaporeSlovak RepublicSloveniaSouth AfricaSouth AsiaSouth Asia (IDA & IBRD)SpainSri LankaSt. Kitts and NevisSt. LuciaSt. Vincent and the GrenadinesSurinameSwazilandSwedenSwitzerlandSyrian Arab RepublicTajikistanTanzaniaThailandTimor-LesteTogoTongaTrinidad and TobagoTunisiaTurkeyTurks and Caicos IslandsTuvaluUgandaUkraineUnited Arab EmiratesUnited KingdomUnited StatesUruguayVanuatuVenezuela, RBVietnamWest Bank and GazaYemen, Rep.ZambiaZimbabwe Timeline:
This timeline shows a graph from 1996 to 2014 of Europe & Central Asia (excluding high income). No data until 1995. Number of actual observations by date: 19.
Source name:
World Development Indicators
Source organization:
International Labour Organization, Key Indicators of the Labour Market database.
Categories, topics:
Social Protection & Labor, Gender
Last updated:
apr 23, 2017
Indicators value changes by year
Minimum:
78.165
jan 1, 2000
Maximum:
81.855
jan 1, 1996
At the date of observation
Value
Absolute change
Change from previous value
jan 1, 1996
81.855
+81.855
0.0%
jan 1, 1997
81.743
-0.113
-0.14%
jan 1, 1998
81.223
-0.52
-0.64%
jan 1, 1999
79.887
-1.336
-1.65%
jan 1, 2000
78.165
-1.722
-2.16%
jan 1, 2001
79.608
+1.444
1.85%
jan 1, 2002
78.847
-0.762
-0.96%
jan 1, 2003
79.735
+0.888
1.13%
jan 1, 2004
78.882
-0.853
-1.07%
jan 1, 2005
80.307
+1.425
1.81%
jan 1, 2006
80.008
-0.299
-0.37%
jan 1, 2007
81.161
+1.153
1.44%
jan 1, 2008
81.404
+0.244
0.3%
jan 1, 2009
80.76
-0.644
-0.79%
jan 1, 2010
79.949
-0.811
-1.0%
jan 1, 2011
79.693
-0.256
-0.32%
jan 1, 2012
79.625
-0.068
-0.09%
jan 1, 2013
80.117
+0.493
0.62%
jan 1, 2014
80.099
-0.018
-0.02%
Ranking of countries by current statistics by years


Comments: