29
/
en
AIzaSyAYiBZKx7MnpbEhh9jyipgxe19OcubqV5w
April 1, 2024
31247
Europe & Central Asia
ECS
false
2
1
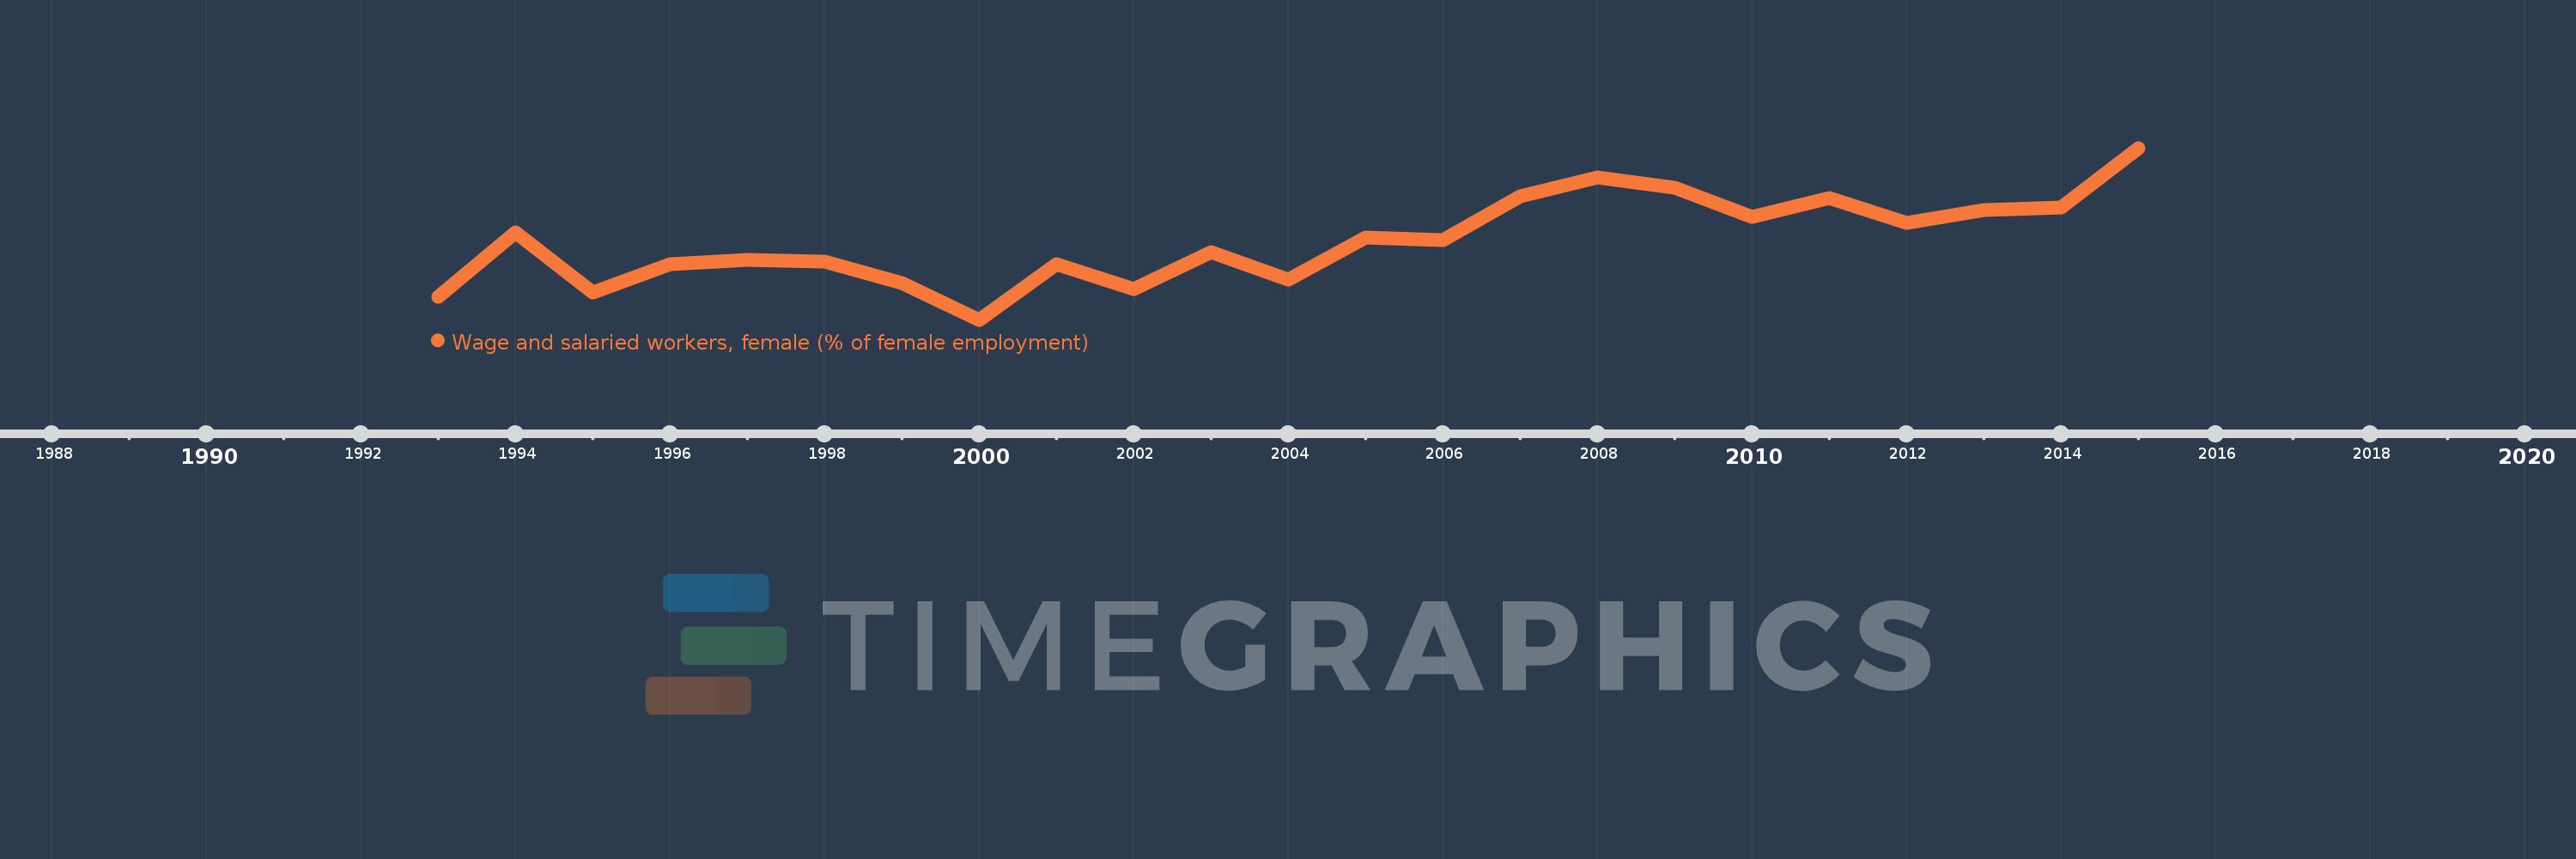
Wage and salaried workers, female (% of female employment)
2015,2014,2013,2012,2011,2010,2009,2008,2007,2006,2005,2004,2003,2002,2001,2000,1999,1998,1997,1996,1995,1994,1993
This statistics in other country:
AlbaniaAlgeriaAmerican SamoaAntigua and BarbudaArgentinaArmeniaArubaAustraliaAustriaAzerbaijanBahamas, TheBahrainBangladeshBarbadosBelarusBelgiumBelizeBeninBermudaBhutanBoliviaBosnia and HerzegovinaBotswanaBrazilBritish Virgin IslandsBrunei DarussalamBulgariaBurkina FasoBurundiCabo VerdeCambodiaCameroonCanadaCaribbean small statesCayman IslandsCentral Europe and the BalticsChadChileColombiaCongo, Rep.Costa RicaCote d'IvoireCroatiaCubaCyprusCzech RepublicDenmarkDjiboutiDominicaDominican RepublicEarly-demographic dividendEcuadorEgypt, Arab Rep.El SalvadorEquatorial GuineaEstoniaEthiopiaEuro areaEurope & Central AsiaEurope & Central Asia (excluding high income)Europe & Central Asia (IDA & IBRD countries)European UnionFijiFinlandFranceFrench PolynesiaGabonGambia, TheGeorgiaGermanyGhanaGreeceGrenadaGuatemalaGuineaGuyanaHaitiHigh incomeHondurasHong Kong SAR, ChinaHungaryIcelandIndiaIndonesiaIran, Islamic Rep.IrelandIsle of ManIsraelItalyJamaicaJapanJordanKazakhstanKenyaKiribatiKorea, Rep.KosovoKuwaitKyrgyz RepublicLao PDRLatin America & Caribbean Latin America & Caribbean (excluding high income)Latin America & the Caribbean (IDA & IBRD countries)LatviaLebanonLesothoLiberiaLithuaniaLower middle incomeLuxembourgMacao SAR, ChinaMacedonia, FYRMadagascarMalawiMalaysiaMaldivesMaliMaltaMarshall IslandsMauritiusMexicoMiddle East & North AfricaMiddle East & North Africa (excluding high income)Middle East & North Africa (IDA & IBRD countries)MoldovaMongoliaMontenegroMoroccoMozambiqueNamibiaNepalNetherlandsNew CaledoniaNew ZealandNicaraguaNigerNorth AmericaNorwayOECD membersOmanPakistanPanamaParaguayPeruPhilippinesPolandPortugalPost-demographic dividendPuerto RicoQatarRomaniaRussian FederationRwandaSamoaSan MarinoSao Tome and PrincipeSaudi ArabiaSenegalSerbiaSeychellesSierra LeoneSingaporeSlovak RepublicSloveniaSouth AfricaSouth AsiaSouth Asia (IDA & IBRD)SpainSri LankaSt. Kitts and NevisSt. LuciaSt. Vincent and the GrenadinesSurinameSwazilandSwedenSwitzerlandSyrian Arab RepublicTajikistanTanzaniaThailandTimor-LesteTogoTongaTrinidad and TobagoTunisiaTurkeyTurks and Caicos IslandsTuvaluUgandaUkraineUnited Arab EmiratesUnited KingdomUnited StatesUruguayVanuatuVenezuela, RBVietnamWest Bank and GazaYemen, Rep.ZambiaZimbabwe Timeline:
This timeline shows a graph from 1993 to 2015 of Europe & Central Asia. No data until 1992. Number of actual observations by date: 23.
Source name:
World Development Indicators
Source organization:
International Labour Organization, Key Indicators of the Labour Market database.
Categories, topics:
Social Protection & Labor, Gender
Last updated:
apr 23, 2017
Indicators value changes by year
Minimum:
83.493
jan 1, 2000
Maximum:
85.742
jan 1, 2015
At the date of observation
Value
Absolute change
Change from previous value
jan 1, 1993
83.798
+83.798
0.0%
jan 1, 1994
84.638
+0.84
1.0%
jan 1, 1995
83.853
-0.785
-0.93%
jan 1, 1996
84.218
+0.365
0.44%
jan 1, 1997
84.281
+0.063
0.08%
jan 1, 1998
84.255
-0.026
-0.03%
jan 1, 1999
83.976
-0.279
-0.33%
jan 1, 2000
83.493
-0.484
-0.58%
jan 1, 2001
84.225
+0.732
0.88%
jan 1, 2002
83.893
-0.332
-0.39%
jan 1, 2003
84.377
+0.484
0.58%
jan 1, 2004
84.022
-0.356
-0.42%
jan 1, 2005
84.569
+0.547
0.65%
jan 1, 2006
84.532
-0.036
-0.04%
jan 1, 2007
85.104
+0.572
0.68%
jan 1, 2008
85.351
+0.247
0.29%
jan 1, 2009
85.224
-0.127
-0.15%
jan 1, 2010
84.842
-0.382
-0.45%
jan 1, 2011
85.084
+0.242
0.29%
jan 1, 2012
84.763
-0.321
-0.38%
jan 1, 2013
84.926
+0.163
0.19%
jan 1, 2014
84.968
+0.042
0.05%
jan 1, 2015
85.742
+0.774
0.91%
Ranking of countries by current statistics by years


Comments: