29
/
en
AIzaSyAYiBZKx7MnpbEhh9jyipgxe19OcubqV5w
April 1, 2024
32308
Europe & Central Asia (excluding high income)
ECA
false
2
1
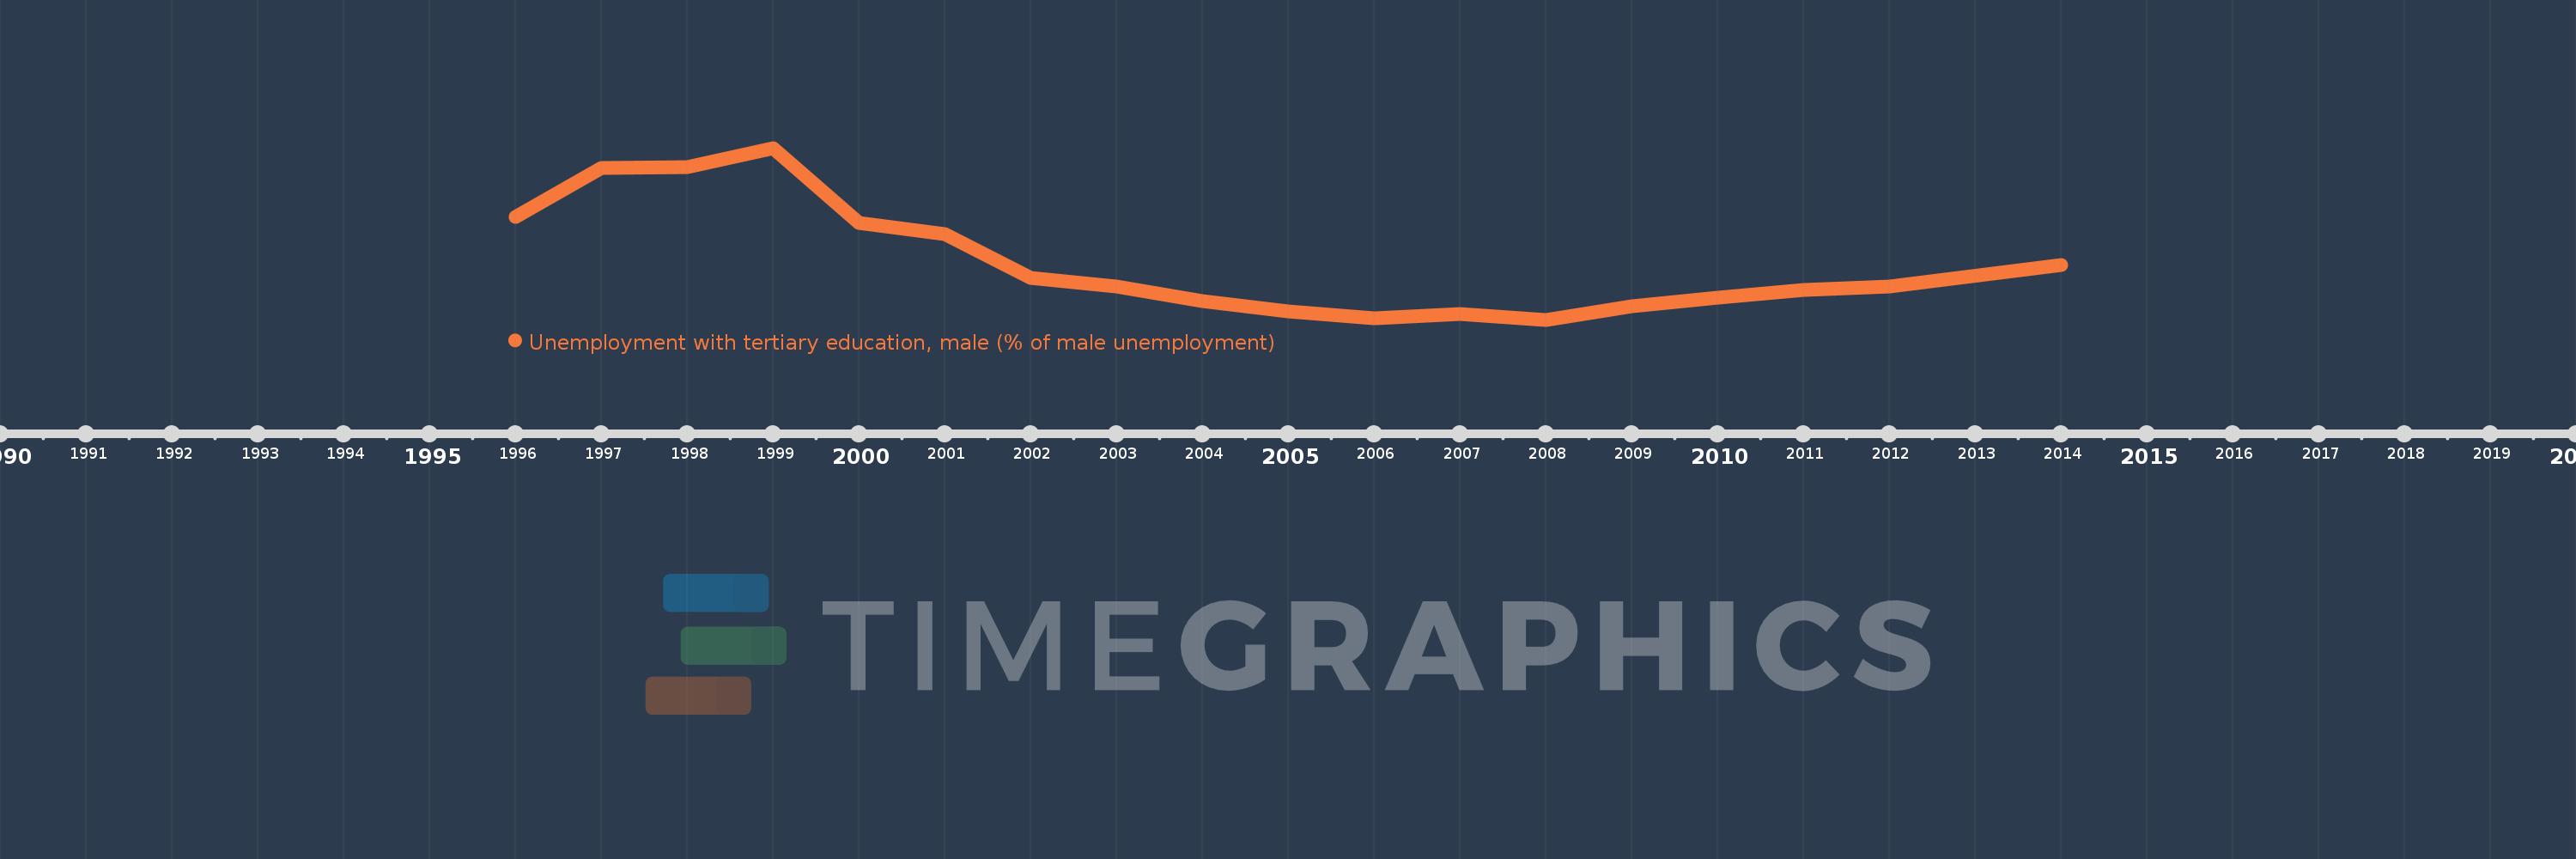
Unemployment with tertiary education, male (% of male unemployment)
2014,2012,2011,2010,2009,2008,2007,2006,2005,2004,2003,2002,2001,2000,1999,1998,1997,1996
This statistics in other country:
Timeline:
This timeline shows a graph from 1996 to 2014 of Europe & Central Asia (excluding high income). No data until 1995. Number of actual observations by date: 18.
Source name:
World Development Indicators
Source organization:
International Labour Organization, Key Indicators of the Labour Market database.
Categories, topics:
Social Protection & Labor, Gender
Last updated:
apr 23, 2017
Indicators value changes by year
Minimum:
19.489
jan 1, 2008
At the date of observation
Value
Absolute change
Change from previous value
jan 1, 1996
28.39
+28.39
0.0%
jan 1, 1997
32.648
+4.258
15.0%
jan 1, 1998
32.753
+0.105
0.32%
jan 1, 1999
34.42
+1.667
5.09%
jan 1, 2000
27.909
-6.511
-18.92%
jan 1, 2001
26.903
-1.006
-3.61%
jan 1, 2002
23.092
-3.811
-14.17%
jan 1, 2003
22.346
-0.746
-3.23%
jan 1, 2004
21.095
-1.251
-5.6%
jan 1, 2005
20.205
-0.89
-4.22%
jan 1, 2006
19.583
-0.622
-3.08%
jan 1, 2007
20.008
+0.426
2.17%
jan 1, 2008
19.489
-0.519
-2.6%
jan 1, 2009
20.684
+1.195
6.13%
jan 1, 2010
21.442
+0.759
3.67%
jan 1, 2011
22.086
+0.644
3.0%
jan 1, 2012
22.365
+0.279
1.26%
jan 1, 2014
24.229
+1.864
8.33%
Ranking of countries by current statistics by years


Comments: