29
/
en
AIzaSyAYiBZKx7MnpbEhh9jyipgxe19OcubqV5w
April 1, 2024
26218
Central Europe and the Baltics
CEB
false
2
1
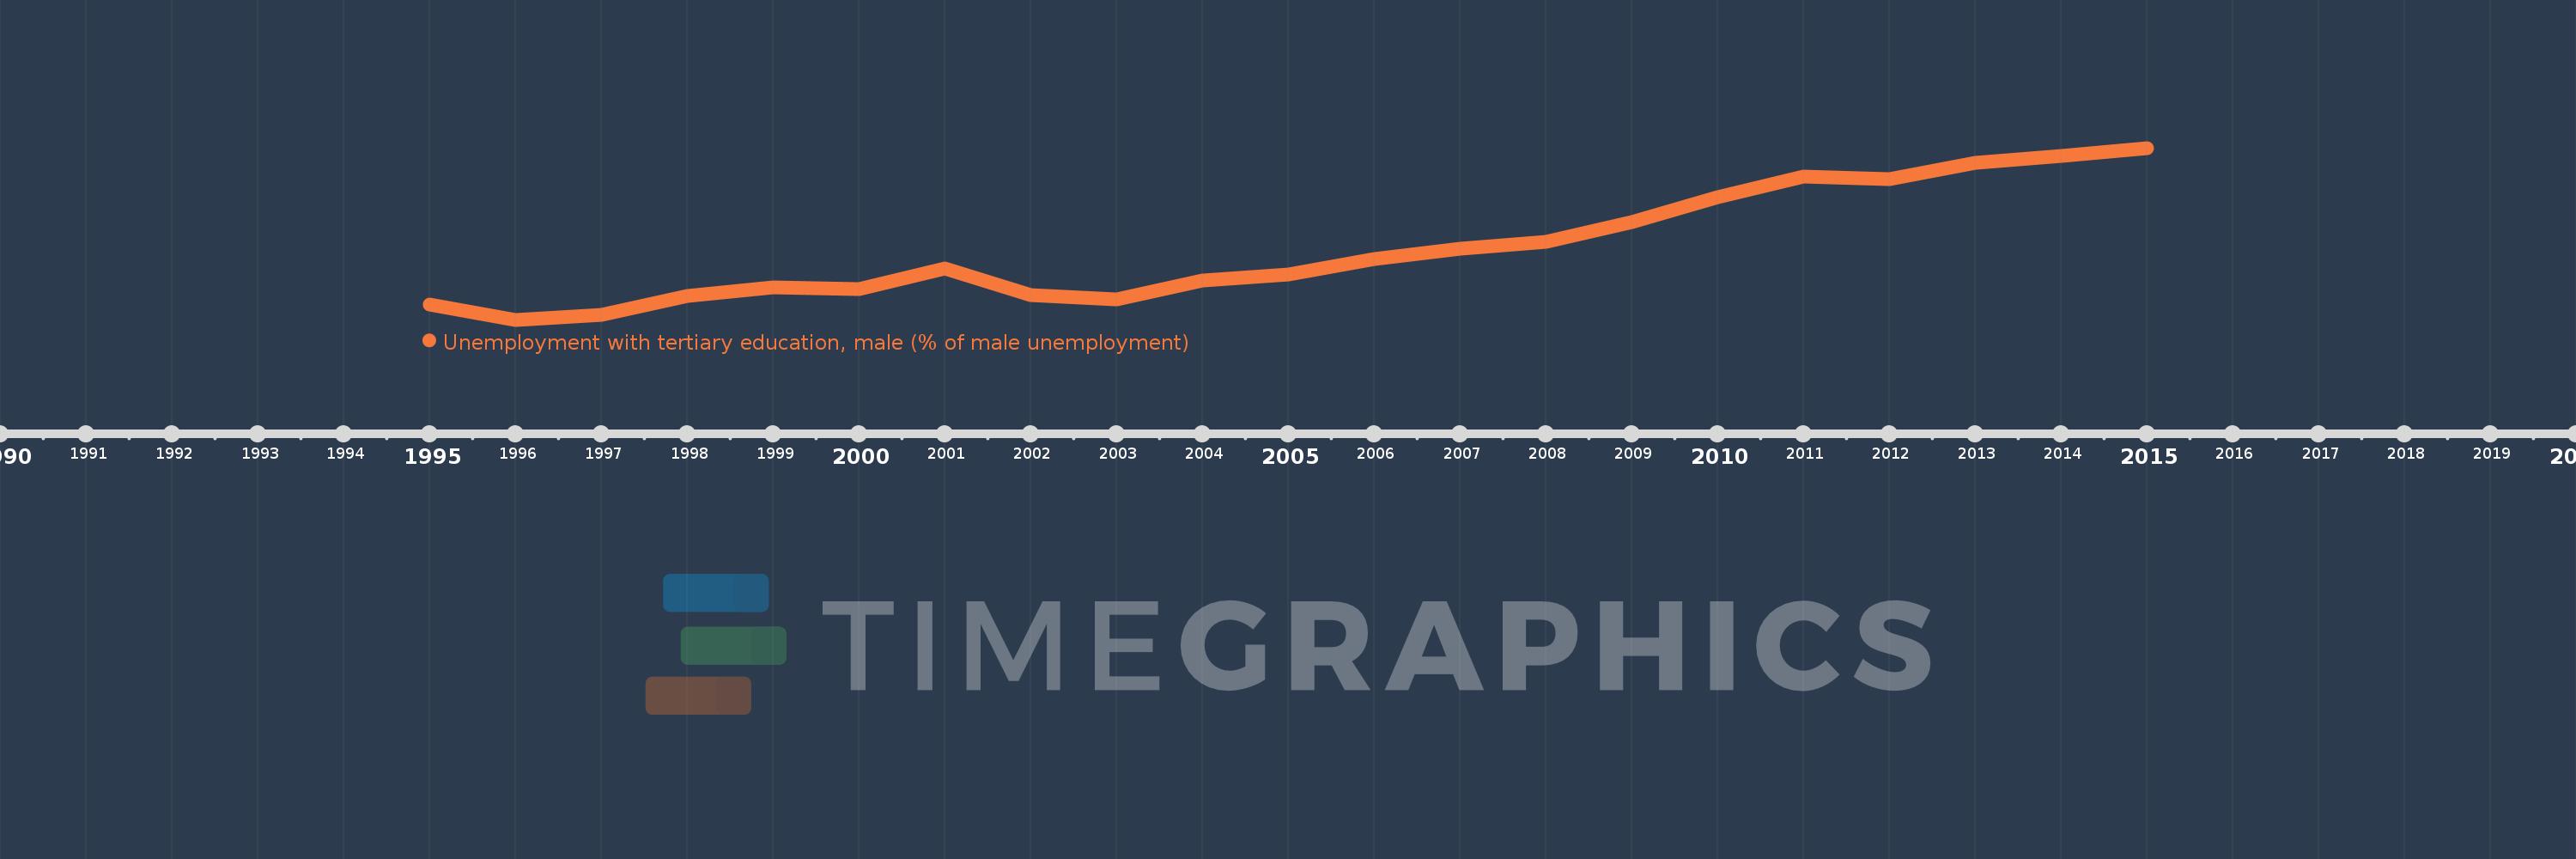
Unemployment with tertiary education, male (% of male unemployment)
2015,2014,2013,2012,2011,2010,2009,2008,2007,2006,2005,2004,2003,2002,2001,2000,1999,1998,1997,1996,1995
This statistics in other country:
Timeline:
This timeline shows a graph from 1995 to 2015 of Central Europe and the Baltics. No data until 1994. Number of actual observations by date: 21.
Source name:
World Development Indicators
Source organization:
International Labour Organization, Key Indicators of the Labour Market database.
Categories, topics:
Social Protection & Labor, Gender
Last updated:
apr 23, 2017
Indicators value changes by year
Maximum:
10.597
jan 1, 2015
At the date of observation
Value
Absolute change
Change from previous value
jan 1, 1995
3.978
+3.978
0.0%
jan 1, 1996
3.35
-0.627
-15.77%
jan 1, 1997
3.555
+0.204
6.1%
jan 1, 1998
4.347
+0.792
22.29%
jan 1, 1999
4.698
+0.351
8.08%
jan 1, 2000
4.647
-0.052
-1.1%
jan 1, 2001
5.498
+0.851
18.31%
jan 1, 2002
4.395
-1.103
-20.06%
jan 1, 2003
4.196
-0.199
-4.52%
jan 1, 2004
4.999
+0.803
19.13%
jan 1, 2005
5.243
+0.244
4.89%
jan 1, 2006
5.918
+0.674
12.86%
jan 1, 2007
6.349
+0.431
7.29%
jan 1, 2008
6.639
+0.29
4.57%
jan 1, 2009
7.468
+0.829
12.49%
jan 1, 2010
8.517
+1.048
14.04%
jan 1, 2011
9.399
+0.883
10.36%
jan 1, 2012
9.287
-0.112
-1.19%
jan 1, 2013
9.985
+0.697
7.51%
jan 1, 2014
10.274
+0.289
2.9%
jan 1, 2015
10.597
+0.323
3.15%
Ranking of countries by current statistics by years


Comments: