29
/
en
AIzaSyAYiBZKx7MnpbEhh9jyipgxe19OcubqV5w
April 1, 2024
32102
Europe & Central Asia (excluding high income)
ECA
false
2
1
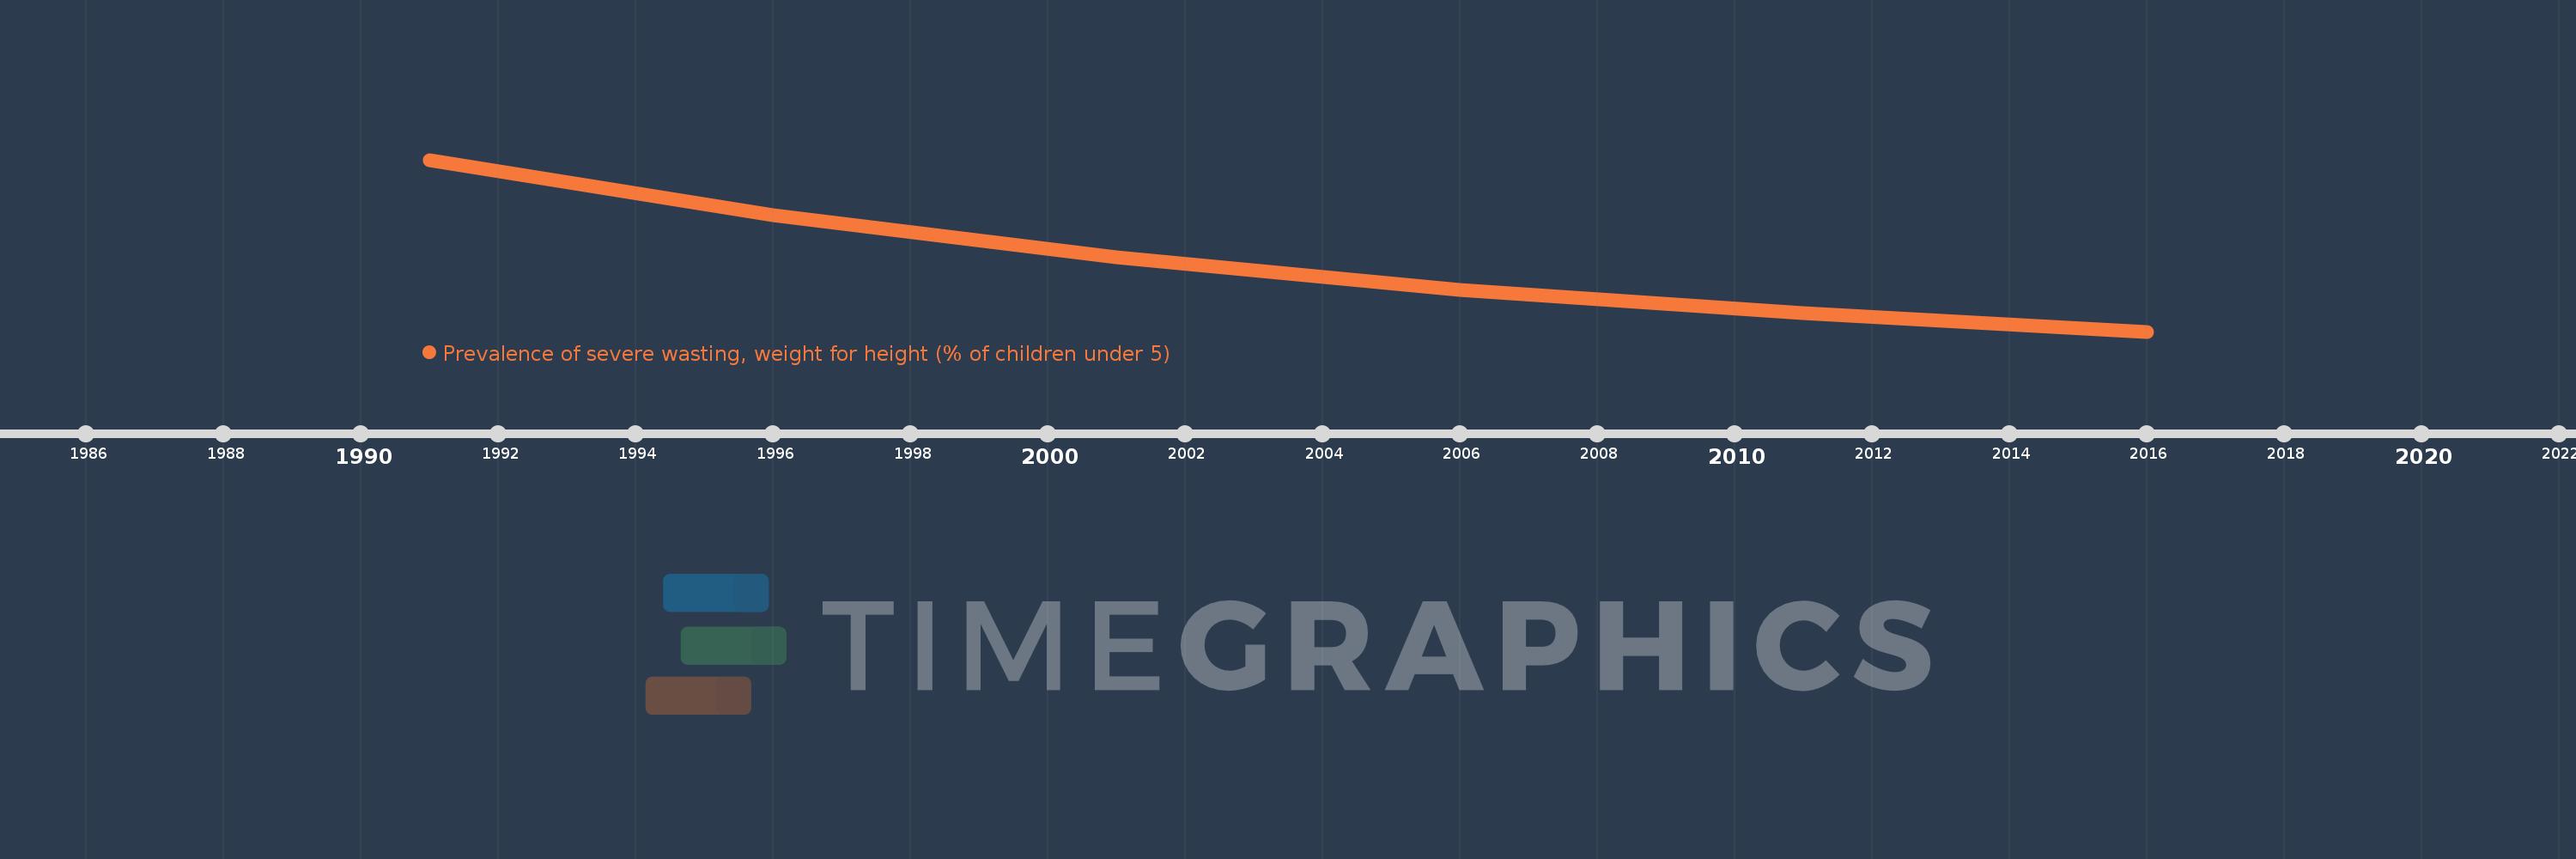
Prevalence of severe wasting, weight for height (% of children under 5)
2016,2011,2006,2001,1996,1991
This statistics in other country:
Timeline:
This timeline shows a graph from 1991 to 2016 of Europe & Central Asia (excluding high income). No data until 1990. Number of actual observations by date: 6.
Source name:
World Development Indicators
Source organization:
World Health Organization, Global Database on Child Growth and Malnutrition. Country-level data are unadjusted data from national surveys, and thus may not be comparable across countries. Adjusted, comparable data are available at http://www.who.int/nutgrowthdb/en. Aggregation is based on UNICEF, WHO, and the World Bank harmonized dataset (adjusted, comparable data) and methodology.
Categories, topics:
Health
Last updated:
apr 23, 2017
Indicators value changes by year
At the date of observation
Value
Absolute change
Change from previous value
jan 1, 1991
2.418
+2.418
0.0%
jan 1, 1996
1.823
-0.595
-24.62%
jan 1, 2001
1.372
-0.451
-24.74%
jan 1, 2006
1.031
-0.341
-24.82%
jan 1, 2011
0.775
-0.257
-24.88%
jan 1, 2016
0.582
-0.193
-24.93%
Ranking of countries by current statistics by years


Comments: