29
/
en
AIzaSyAYiBZKx7MnpbEhh9jyipgxe19OcubqV5w
April 1, 2024
147355
Guinea-Bissau
GNB
true
2
1
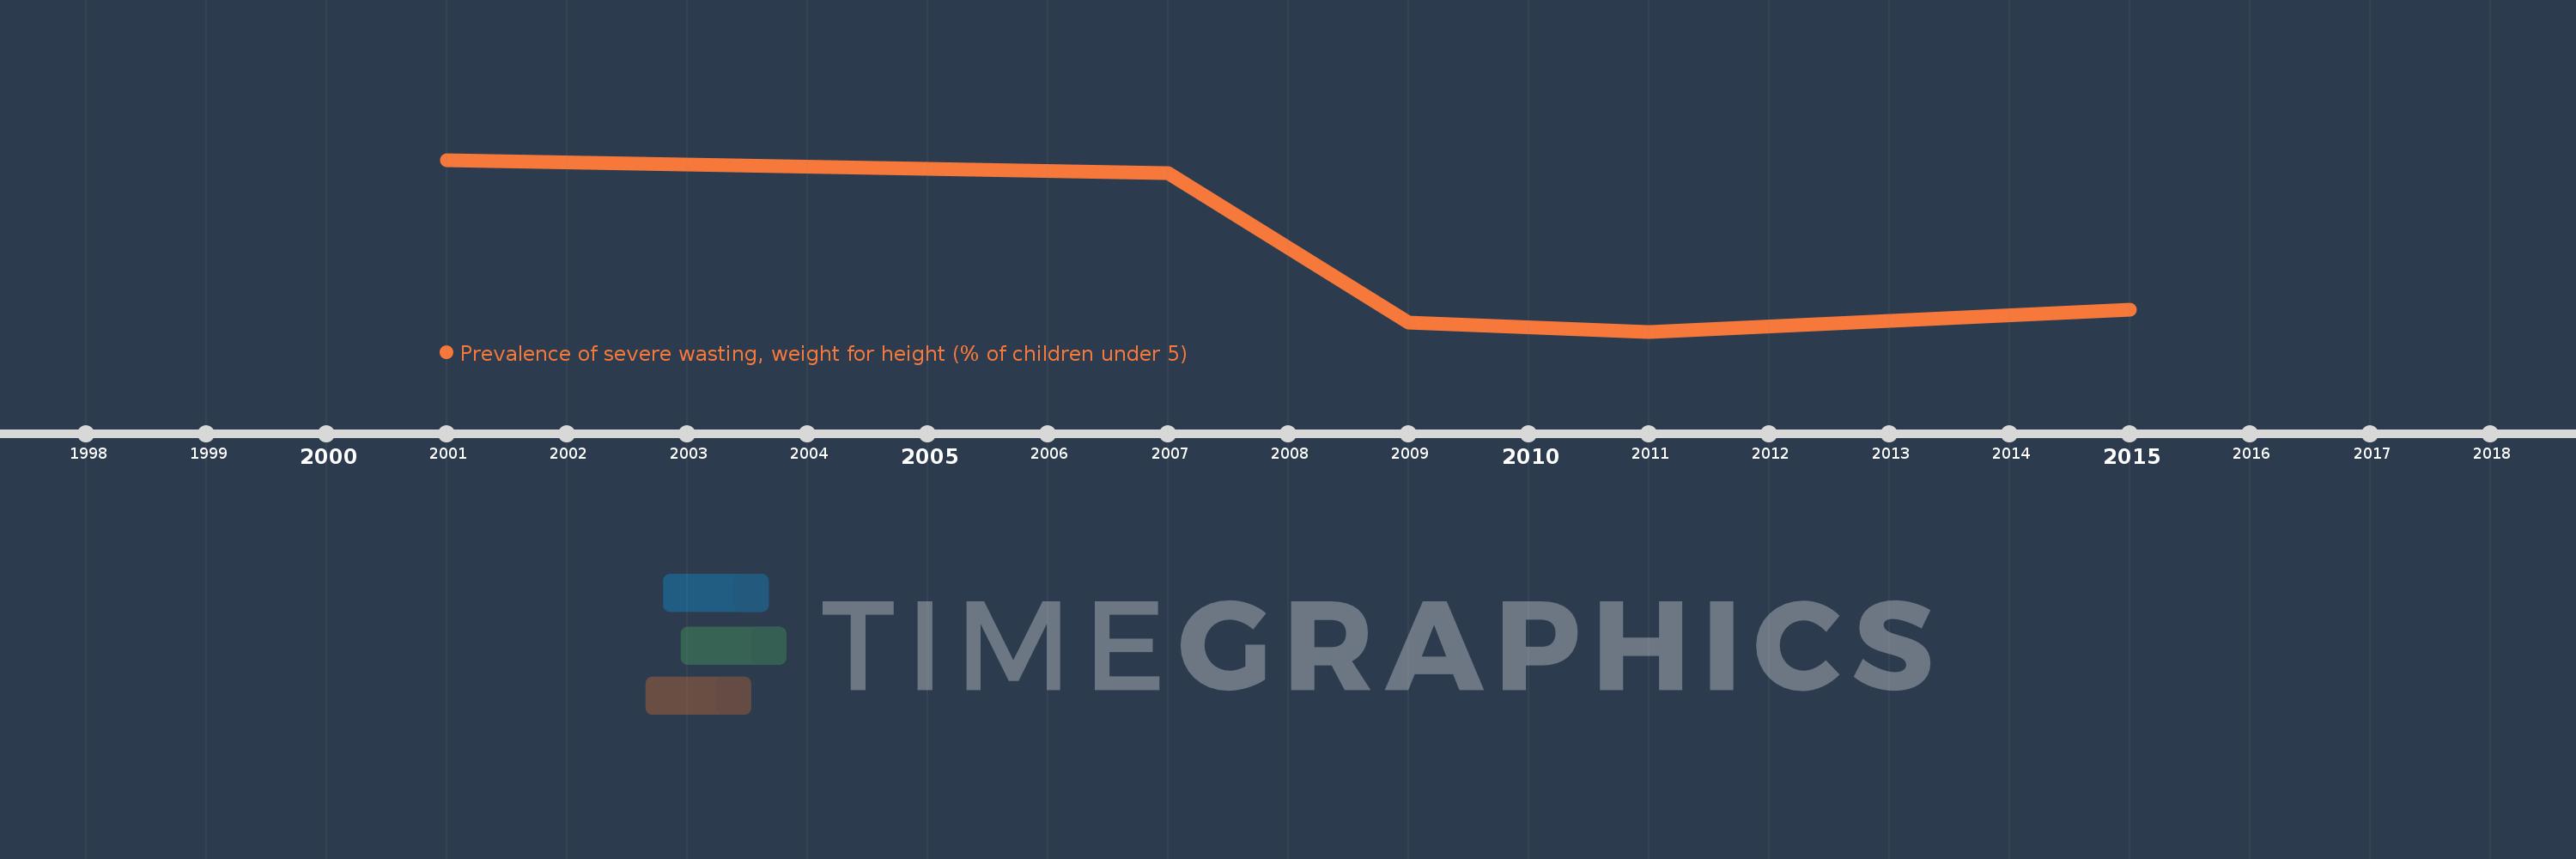
Prevalence of severe wasting, weight for height (% of children under 5)
2015,2011,2009,2007,2001
This statistics in other country:
Timeline:
This timeline shows a graph from 2001 to 2015 of Guinea-Bissau. No data until 2000. Number of actual observations by date: 5.
Source name:
World Development Indicators
Source organization:
World Health Organization, Global Database on Child Growth and Malnutrition. Country-level data are unadjusted data from national surveys, and thus may not be comparable across countries. Adjusted, comparable data are available at http://www.who.int/nutgrowthdb/en. Aggregation is based on UNICEF, WHO, and the World Bank harmonized dataset (adjusted, comparable data) and methodology.
Categories, topics:
Health
Last updated:
apr 23, 2017
Indicators value changes by year
At the date of observation
Value
Absolute change
Change from previous value
jan 1, 2007
4.5
-0.3
-6.25%
jan 1, 2009
1.1
-3.4
-75.56%
jan 1, 2011
0.9
-0.2
-18.18%
jan 1, 2015
1.4
+0.5
55.56%
Ranking of countries by current statistics by years


Comments: