29
/
en
AIzaSyAYiBZKx7MnpbEhh9jyipgxe19OcubqV5w
April 1, 2024
31927
Europe & Central Asia (excluding high income)
ECA
false
2
1
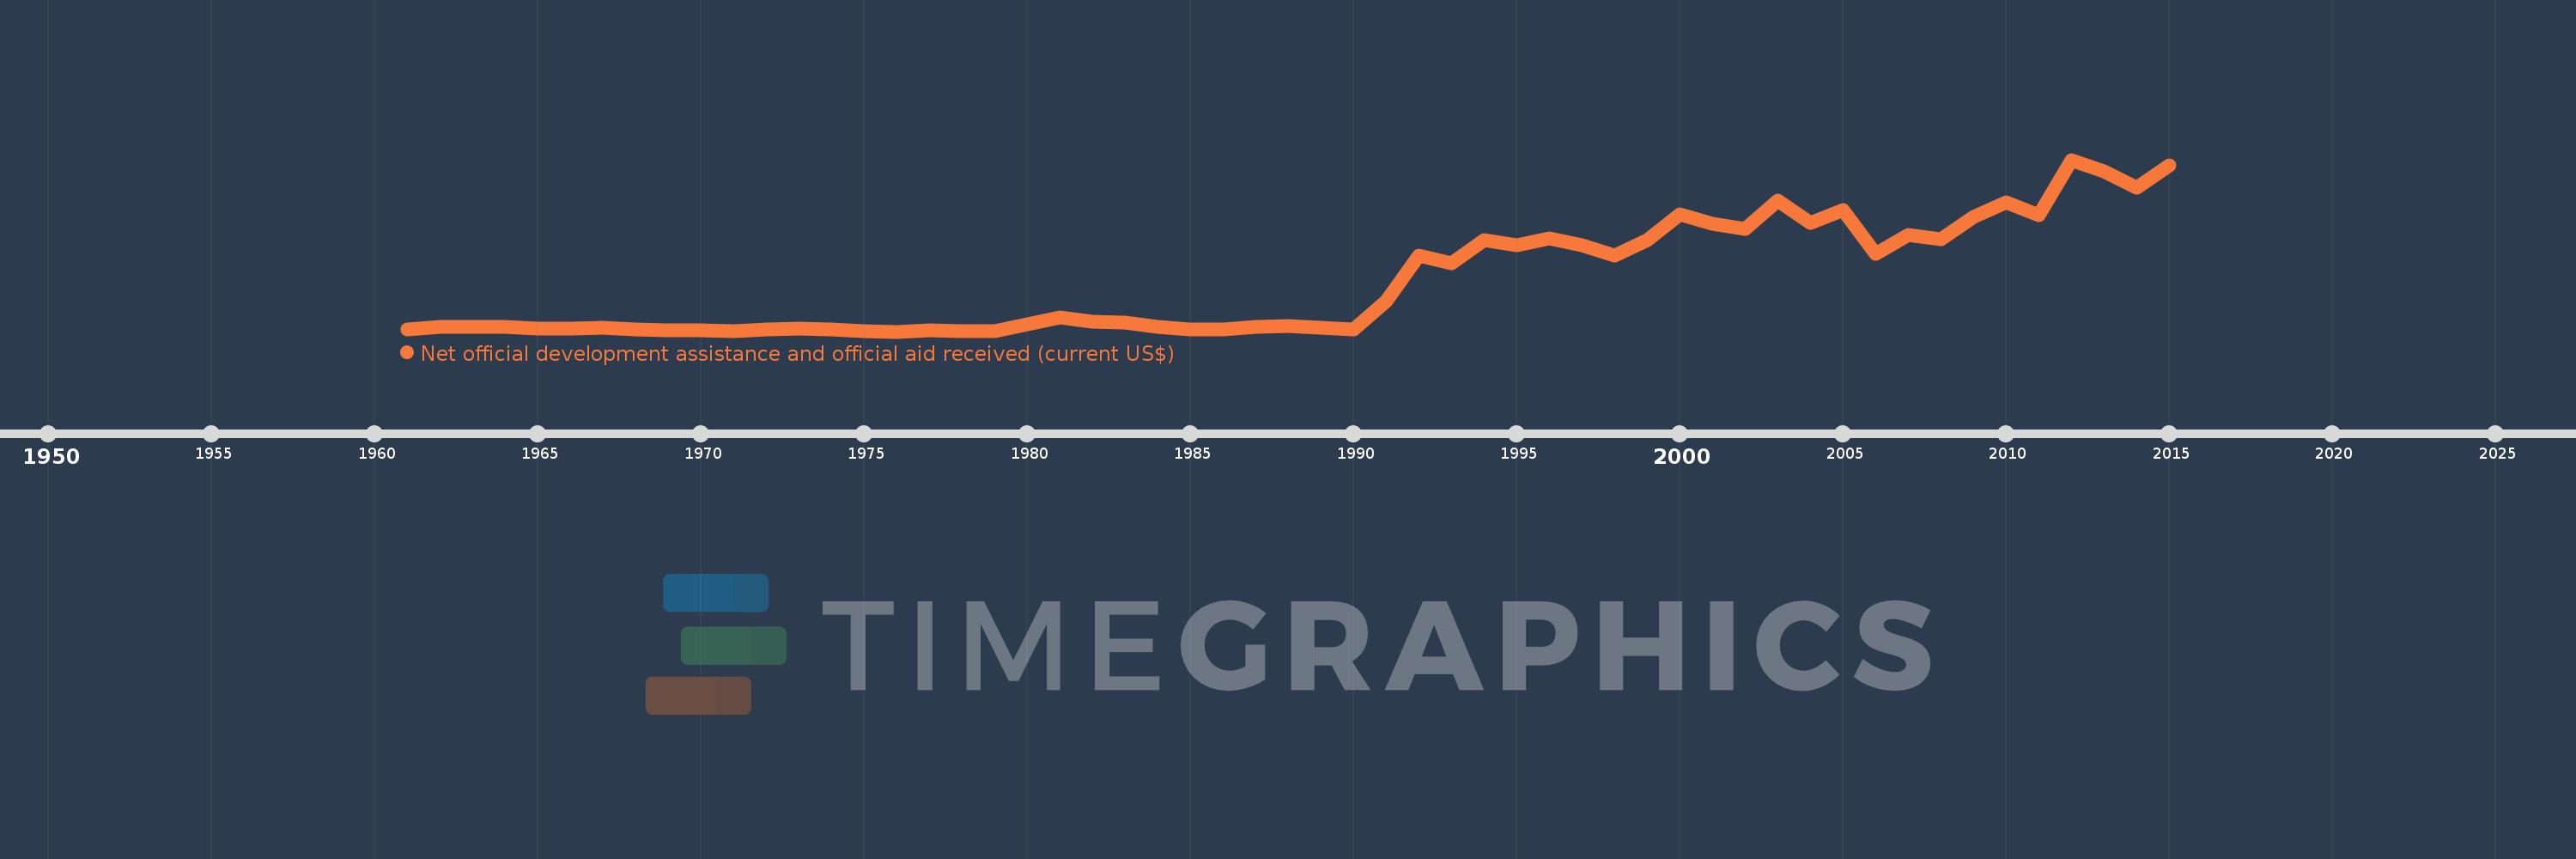
Net official development assistance and official aid received (current US$)
2015,2014,2013,2012,2011,2010,2009,2008,2007,2006,2005,2004,2003,2002,2001,2000,1999,1998,1997,1996,1995,1994,1993,1992,1991,1990,1989,1988,1987,1986,1985,1984,1983,1982,1981,1980,1979,1978,1977,1976,1975,1974,1973,1972,1971,1970,1969,1968,1967,1966,1965,1964,1963,1962,1961
This statistics in other country:
AfghanistanAlbaniaAlgeriaAngolaAntigua and BarbudaArab WorldArgentinaArmeniaArubaAzerbaijanBahamas, TheBahrainBangladeshBarbadosBelarusBelizeBeninBermudaBhutanBoliviaBosnia and HerzegovinaBotswanaBrazilBritish Virgin IslandsBrunei DarussalamBulgariaBurkina FasoBurundiCabo VerdeCambodiaCameroonCaribbean small statesCayman IslandsCentral African RepublicCentral Europe and the BalticsChadChileChinaColombiaComorosCongo, Dem. Rep.Congo, Rep.Costa RicaCote d'IvoireCroatiaCubaCyprusCzech RepublicDjiboutiDominicaDominican RepublicEast Asia & PacificEast Asia & Pacific (excluding high income)East Asia & Pacific (IDA & IBRD countries)EcuadorEgypt, Arab Rep.El SalvadorEquatorial GuineaEritreaEstoniaEthiopiaEuro areaEurope & Central AsiaEurope & Central Asia (excluding high income)Europe & Central Asia (IDA & IBRD countries)European UnionFijiFragile and conflict affected situationsFrench PolynesiaGabonGambia, TheGeorgiaGhanaGibraltarGrenadaGuatemalaGuineaGuinea-BissauGuyanaHaitiHeavily indebted poor countries (HIPC)High incomeHondurasHong Kong SAR, ChinaHungaryIBRD onlyIDA & IBRD totalIDA blendIDA onlyIDA totalIndiaIndonesiaIran, Islamic Rep.IraqIsraelJamaicaJordanKazakhstanKenyaKiribatiKorea, Dem. People’s Rep.Korea, Rep.KosovoKuwaitKyrgyz RepublicLao PDRLatin America & Caribbean Latin America & Caribbean (excluding high income)Latin America & the Caribbean (IDA & IBRD countries)LatviaLeast developed countries: UN classificationLebanonLesothoLiberiaLibyaLithuaniaLow & middle incomeLow incomeLower middle incomeMacao SAR, ChinaMacedonia, FYRMadagascarMalawiMalaysiaMaldivesMaliMaltaMarshall IslandsMauritaniaMauritiusMexicoMicronesia, Fed. Sts.Middle East & North AfricaMiddle East & North Africa (excluding high income)Middle East & North Africa (IDA & IBRD countries)Middle incomeMoldovaMongoliaMontenegroMoroccoMozambiqueMyanmarNamibiaNauruNepalNew CaledoniaNicaraguaNigerNigeriaNorth AmericaNorthern Mariana IslandsOECD membersOmanOther small statesPacific island small statesPakistanPalauPanamaPapua New GuineaParaguayPeruPhilippinesPolandQatarRomaniaRussian FederationRwandaSamoaSao Tome and PrincipeSaudi ArabiaSenegalSerbiaSeychellesSierra LeoneSingaporeSlovak RepublicSloveniaSmall statesSolomon IslandsSomaliaSouth AfricaSouth AsiaSouth Asia (IDA & IBRD)South SudanSri LankaSt. Kitts and NevisSt. LuciaSt. Vincent and the GrenadinesSub-Saharan Africa Sub-Saharan Africa (excluding high income)Sub-Saharan Africa (IDA & IBRD countries)SudanSurinameSwazilandSyrian Arab RepublicTajikistanTanzaniaThailandTimor-LesteTogoTongaTrinidad and TobagoTunisiaTurkeyTurkmenistanTurks and Caicos IslandsTuvaluUgandaUkraineUnited Arab EmiratesUpper middle incomeUruguayUzbekistanVanuatuVenezuela, RBVietnamWest Bank and GazaWorldYemen, Rep.ZambiaZimbabwe Timeline:
This timeline shows a graph from 1961 to 2015 of Europe & Central Asia (excluding high income). No data until 1960. Number of actual observations by date: 55.
Source name:
World Development Indicators
Source organization:
Development Assistance Committee of the Organisation for Economic Co-operation and Development, Geographical Distribution of Financial Flows to Developing Countries, Development Co-operation Report, and International Development Statistics database. Data are available online at: www.oecd.org/dac/stats/idsonline.
Categories, topics:
Aid Effectiveness
Last updated:
apr 23, 2017
Indicators value changes by year
Minimum:
84.04 mln
jan 1, 1976
Maximum:
10.718 bln
jan 1, 2012
At the date of observation
Value
Absolute change
Change from previous value
jan 1, 1961
207.2 mln
+207.2 mln
0.0%
jan 1, 1962
353.36 mln
+146.16 mln
70.54%
jan 1, 1963
395.36 mln
+42.0 mln
11.89%
jan 1, 1964
377.58 mln
-17.78 mln
-4.5%
jan 1, 1965
263.15 mln
-114.43 mln
-30.31%
jan 1, 1966
266.0 mln
+2.85 mln
1.08%
jan 1, 1967
318.34 mln
+52.34 mln
19.68%
jan 1, 1968
200.88 mln
-117.46 mln
-36.9%
jan 1, 1969
167.69 mln
-33.19 mln
-16.52%
jan 1, 1970
178.24 mln
+10.55 mln
6.29%
jan 1, 1971
136.62 mln
-41.62 mln
-23.35%
jan 1, 1972
199.72 mln
+63.1 mln
46.19%
jan 1, 1973
267.66 mln
+67.94 mln
34.02%
jan 1, 1974
204.52 mln
-63.14 mln
-23.59%
jan 1, 1975
114.03 mln
-90.49 mln
-44.25%
jan 1, 1976
84.04 mln
-29.99 mln
-26.3%
jan 1, 1977
157.17 mln
+73.13 mln
87.02%
jan 1, 1978
99.88 mln
-57.29 mln
-36.45%
jan 1, 1979
130.5 mln
+30.62 mln
30.66%
jan 1, 1980
554.12 mln
+423.62 mln
324.61%
jan 1, 1981
935.9 mln
+381.78 mln
68.9%
jan 1, 1982
712.24 mln
-223.66 mln
-23.9%
jan 1, 1983
639.7 mln
-72.54 mln
-10.18%
jan 1, 1984
358.39 mln
-281.31 mln
-43.98%
jan 1, 1985
243.26 mln
-115.13 mln
-32.12%
jan 1, 1986
190.39 mln
-52.87 mln
-21.73%
jan 1, 1987
358.27 mln
+167.88 mln
88.18%
jan 1, 1988
413.72 mln
+55.45 mln
15.48%
jan 1, 1989
331.09 mln
-82.63 mln
-19.97%
jan 1, 1990
198.16 mln
-132.93 mln
-40.15%
jan 1, 1991
1.987 bln
+1.789 bln
902.56%
jan 1, 1992
4.793 bln
+2.807 bln
141.27%
jan 1, 1993
4.335 bln
-458.6 mln
-9.57%
jan 1, 1994
5.752 bln
+1.417 bln
32.69%
jan 1, 1995
5.427 bln
-324.63 mln
-5.64%
jan 1, 1996
5.878 bln
+451.11 mln
8.31%
jan 1, 1997
5.438 bln
-440.09 mln
-7.49%
jan 1, 1998
4.816 bln
-622.08 mln
-11.44%
jan 1, 1999
5.729 bln
+912.86 mln
18.95%
jan 1, 2000
7.358 bln
+1.629 bln
28.43%
jan 1, 2001
6.742 bln
-615.36 mln
-8.36%
jan 1, 2002
6.416 bln
-326.31 mln
-4.84%
jan 1, 2003
8.202 bln
+1.786 bln
27.84%
jan 1, 2004
6.801 bln
-1.401 bln
-17.09%
jan 1, 2005
7.607 bln
+806.11 mln
11.85%
jan 1, 2006
4.899 bln
-2.708 bln
-35.59%
jan 1, 2007
6.077 bln
+1.178 bln
24.05%
jan 1, 2008
5.78 bln
-297.78 mln
-4.9%
jan 1, 2009
7.207 bln
+1.427 bln
24.69%
jan 1, 2010
8.098 bln
+891.12 mln
12.37%
jan 1, 2011
7.31 bln
-788.08 mln
-9.73%
jan 1, 2012
10.718 bln
+3.408 bln
46.62%
jan 1, 2013
9.992 bln
-726.32 mln
-6.78%
jan 1, 2014
8.971 bln
-1.02 bln
-10.21%
jan 1, 2015
10.367 bln
+1.396 bln
15.56%
Ranking of countries by current statistics by years


Comments: