29
/
en
AIzaSyAYiBZKx7MnpbEhh9jyipgxe19OcubqV5w
April 1, 2024
50300
Middle East & North Africa (IDA & IBRD countries)
TMN
false
2
1
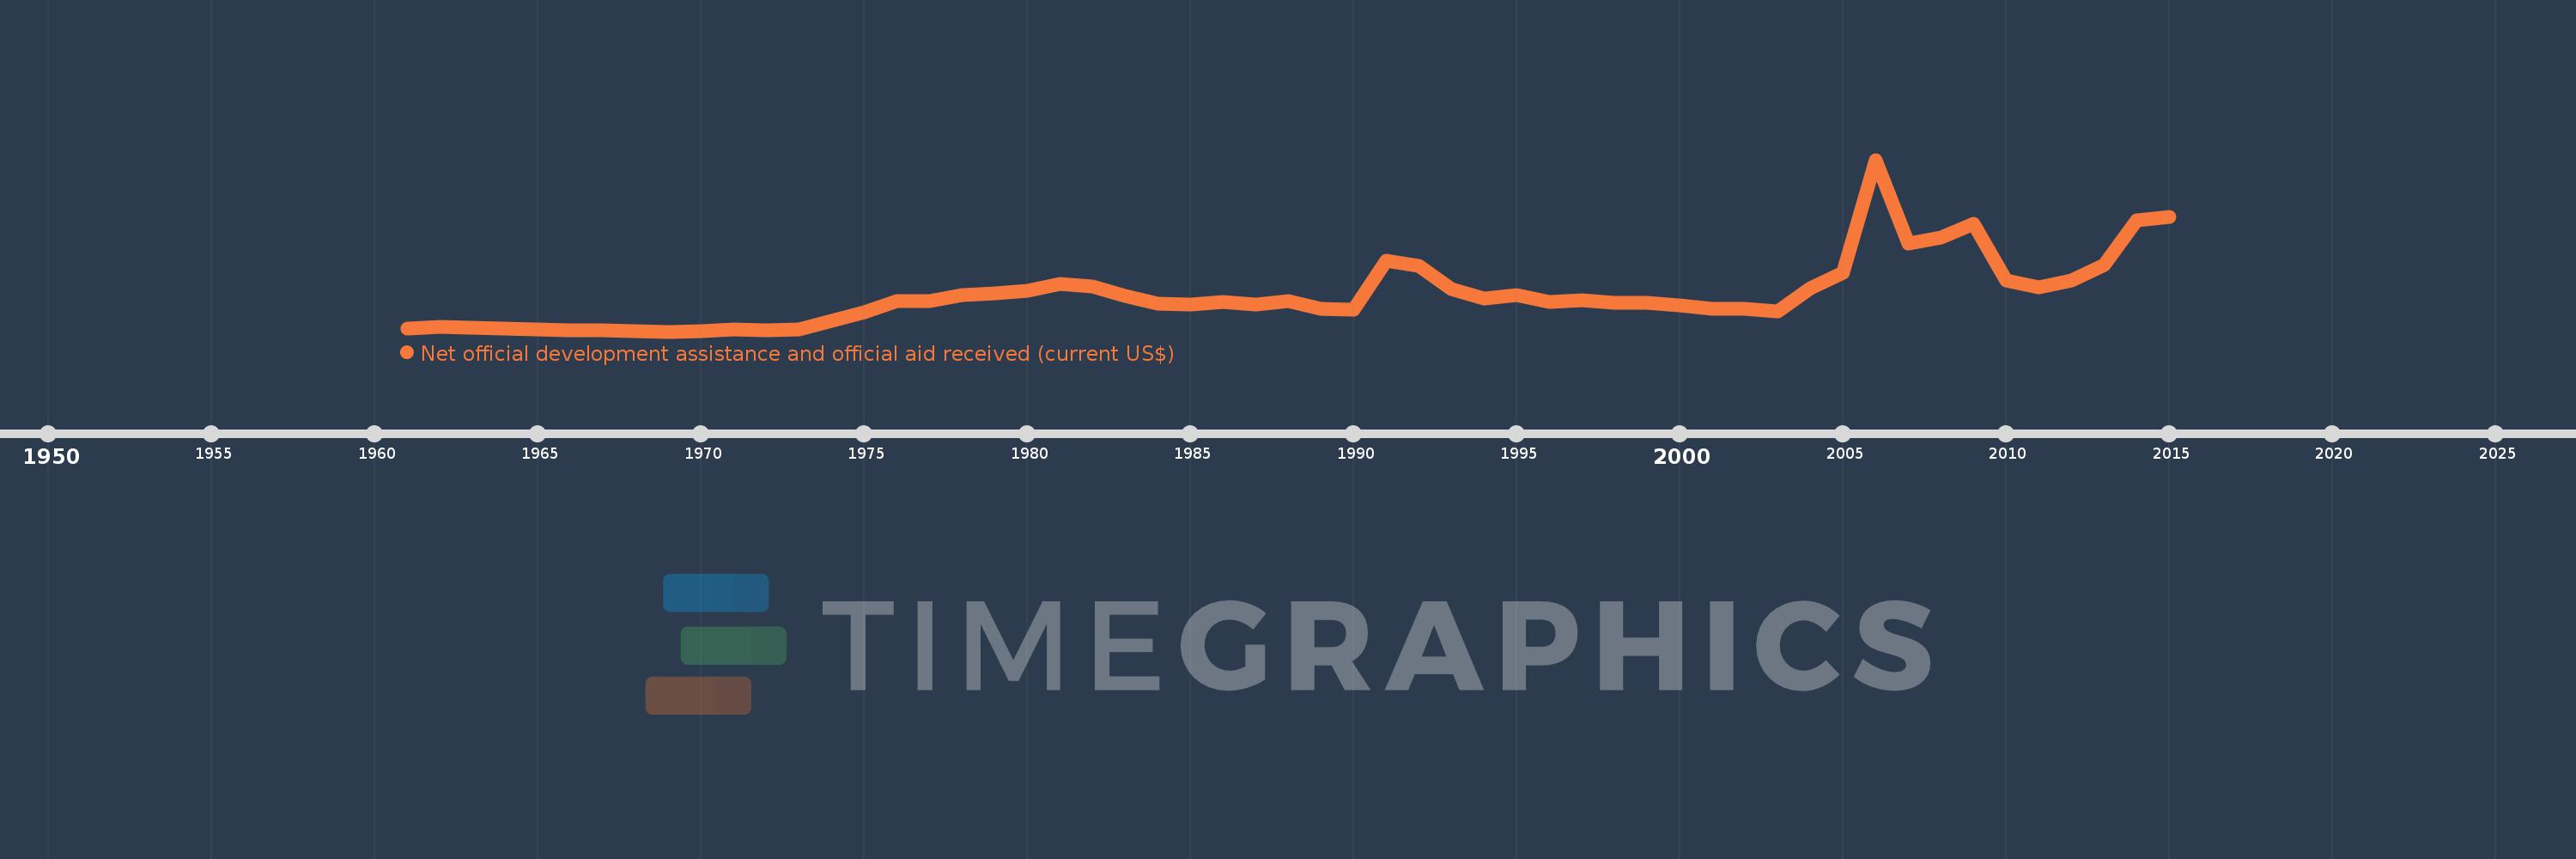
Net official development assistance and official aid received (current US$)
2015,2014,2013,2012,2011,2010,2009,2008,2007,2006,2005,2004,2003,2002,2001,2000,1999,1998,1997,1996,1995,1994,1993,1992,1991,1990,1989,1988,1987,1986,1985,1984,1983,1982,1981,1980,1979,1978,1977,1976,1975,1974,1973,1972,1971,1970,1969,1968,1967,1966,1965,1964,1963,1962,1961
This statistics in other country:
AfghanistanAlbaniaAlgeriaAngolaAntigua and BarbudaArab WorldArgentinaArmeniaArubaAzerbaijanBahamas, TheBahrainBangladeshBarbadosBelarusBelizeBeninBermudaBhutanBoliviaBosnia and HerzegovinaBotswanaBrazilBritish Virgin IslandsBrunei DarussalamBulgariaBurkina FasoBurundiCabo VerdeCambodiaCameroonCaribbean small statesCayman IslandsCentral African RepublicCentral Europe and the BalticsChadChileChinaColombiaComorosCongo, Dem. Rep.Congo, Rep.Costa RicaCote d'IvoireCroatiaCubaCyprusCzech RepublicDjiboutiDominicaDominican RepublicEast Asia & PacificEast Asia & Pacific (excluding high income)East Asia & Pacific (IDA & IBRD countries)EcuadorEgypt, Arab Rep.El SalvadorEquatorial GuineaEritreaEstoniaEthiopiaEuro areaEurope & Central AsiaEurope & Central Asia (excluding high income)Europe & Central Asia (IDA & IBRD countries)European UnionFijiFragile and conflict affected situationsFrench PolynesiaGabonGambia, TheGeorgiaGhanaGibraltarGrenadaGuatemalaGuineaGuinea-BissauGuyanaHaitiHeavily indebted poor countries (HIPC)High incomeHondurasHong Kong SAR, ChinaHungaryIBRD onlyIDA & IBRD totalIDA blendIDA onlyIDA totalIndiaIndonesiaIran, Islamic Rep.IraqIsraelJamaicaJordanKazakhstanKenyaKiribatiKorea, Dem. People’s Rep.Korea, Rep.KosovoKuwaitKyrgyz RepublicLao PDRLatin America & Caribbean Latin America & Caribbean (excluding high income)Latin America & the Caribbean (IDA & IBRD countries)LatviaLeast developed countries: UN classificationLebanonLesothoLiberiaLibyaLithuaniaLow & middle incomeLow incomeLower middle incomeMacao SAR, ChinaMacedonia, FYRMadagascarMalawiMalaysiaMaldivesMaliMaltaMarshall IslandsMauritaniaMauritiusMexicoMicronesia, Fed. Sts.Middle East & North AfricaMiddle East & North Africa (excluding high income)Middle East & North Africa (IDA & IBRD countries)Middle incomeMoldovaMongoliaMontenegroMoroccoMozambiqueMyanmarNamibiaNauruNepalNew CaledoniaNicaraguaNigerNigeriaNorth AmericaNorthern Mariana IslandsOECD membersOmanOther small statesPacific island small statesPakistanPalauPanamaPapua New GuineaParaguayPeruPhilippinesPolandQatarRomaniaRussian FederationRwandaSamoaSao Tome and PrincipeSaudi ArabiaSenegalSerbiaSeychellesSierra LeoneSingaporeSlovak RepublicSloveniaSmall statesSolomon IslandsSomaliaSouth AfricaSouth AsiaSouth Asia (IDA & IBRD)South SudanSri LankaSt. Kitts and NevisSt. LuciaSt. Vincent and the GrenadinesSub-Saharan Africa Sub-Saharan Africa (excluding high income)Sub-Saharan Africa (IDA & IBRD countries)SudanSurinameSwazilandSyrian Arab RepublicTajikistanTanzaniaThailandTimor-LesteTogoTongaTrinidad and TobagoTunisiaTurkeyTurkmenistanTurks and Caicos IslandsTuvaluUgandaUkraineUnited Arab EmiratesUpper middle incomeUruguayUzbekistanVanuatuVenezuela, RBVietnamWest Bank and GazaWorldYemen, Rep.ZambiaZimbabwe Timeline:
This timeline shows a graph from 1961 to 2015 of Middle East & North Africa (IDA & IBRD countries). No data until 1960. Number of actual observations by date: 55.
Source name:
World Development Indicators
Source organization:
Development Assistance Committee of the Organisation for Economic Co-operation and Development, Geographical Distribution of Financial Flows to Developing Countries, Development Co-operation Report, and International Development Statistics database. Data are available online at: www.oecd.org/dac/stats/idsonline.
Categories, topics:
Aid Effectiveness
Last updated:
apr 23, 2017
Indicators value changes by year
Minimum:
413.32 mln
jan 1, 1969
Maximum:
26.047 bln
jan 1, 2006
At the date of observation
Value
Absolute change
Change from previous value
jan 1, 1961
851.31 mln
+851.31 mln
0.0%
jan 1, 1962
1.064 bln
+212.36 mln
24.95%
jan 1, 1963
960.21 mln
-103.46 mln
-9.73%
jan 1, 1964
840.84 mln
-119.37 mln
-12.43%
jan 1, 1965
777.88 mln
-62.96 mln
-7.49%
jan 1, 1966
618.25 mln
-159.63 mln
-20.52%
jan 1, 1967
573.32 mln
-44.93 mln
-7.27%
jan 1, 1968
433.45 mln
-139.87 mln
-24.4%
jan 1, 1969
413.32 mln
-20.13 mln
-4.64%
jan 1, 1970
447.13 mln
+33.81 mln
8.18%
jan 1, 1971
675.46 mln
+228.33 mln
51.07%
jan 1, 1972
660.49 mln
-14.97 mln
-2.22%
jan 1, 1973
747.03 mln
+86.54 mln
13.1%
jan 1, 1974
1.997 bln
+1.25 bln
167.32%
jan 1, 1975
3.26 bln
+1.263 bln
63.25%
jan 1, 1976
4.973 bln
+1.713 bln
52.54%
jan 1, 1977
4.995 bln
+22.13 mln
0.44%
jan 1, 1978
5.86 bln
+864.89 mln
17.31%
jan 1, 1979
6.082 bln
+222.31 mln
3.79%
jan 1, 1980
6.498 bln
+415.88 mln
6.84%
jan 1, 1981
7.48 bln
+981.47 mln
15.1%
jan 1, 1982
7.111 bln
-368.94 mln
-4.93%
jan 1, 1983
5.687 bln
-1.424 bln
-20.03%
jan 1, 1984
4.624 bln
-1.063 bln
-18.68%
jan 1, 1985
4.502 bln
-121.65 mln
-2.63%
jan 1, 1986
4.83 bln
+327.73 mln
7.28%
jan 1, 1987
4.436 bln
-394.49 mln
-8.17%
jan 1, 1988
4.934 bln
+498.73 mln
11.24%
jan 1, 1989
3.776 bln
-1.159 bln
-23.49%
jan 1, 1990
3.723 bln
-52.83 mln
-1.4%
jan 1, 1991
10.977 bln
+7.254 bln
194.87%
jan 1, 1992
10.266 bln
-711.34 mln
-6.48%
jan 1, 1993
6.802 bln
-3.464 bln
-33.74%
jan 1, 1994
5.302 bln
-1.499 bln
-22.04%
jan 1, 1995
5.808 bln
+505.91 mln
9.54%
jan 1, 1996
4.787 bln
-1.021 bln
-17.58%
jan 1, 1997
5.098 bln
+311.29 mln
6.5%
jan 1, 1998
4.725 bln
-373.39 mln
-7.32%
jan 1, 1999
4.741 bln
+15.74 mln
0.33%
jan 1, 2000
4.328 bln
-412.68 mln
-8.71%
jan 1, 2001
3.767 bln
-560.43 mln
-12.95%
jan 1, 2002
3.83 bln
+62.33 mln
1.65%
jan 1, 2003
3.436 bln
-393.31 mln
-10.27%
jan 1, 2004
6.863 bln
+3.426 bln
99.7%
jan 1, 2005
9.154 bln
+2.291 bln
33.39%
jan 1, 2006
26.047 bln
+16.894 bln
184.56%
jan 1, 2007
13.528 bln
-12.519 bln
-48.06%
jan 1, 2008
14.454 bln
+925.29 mln
6.84%
jan 1, 2009
16.486 bln
+2.032 bln
14.06%
jan 1, 2010
8.045 bln
-8.44 bln
-51.2%
jan 1, 2011
6.967 bln
-1.078 bln
-13.4%
jan 1, 2012
8.023 bln
+1.055 bln
15.15%
jan 1, 2013
10.368 bln
+2.346 bln
29.24%
jan 1, 2014
17.071 bln
+6.703 bln
64.64%
jan 1, 2015
17.562 bln
+491.27 mln
2.88%
Ranking of countries by current statistics by years


Comments: