29
/
en
AIzaSyAYiBZKx7MnpbEhh9jyipgxe19OcubqV5w
April 1, 2024
31327
Europe & Central Asia (excluding high income)
ECA
false
2
1
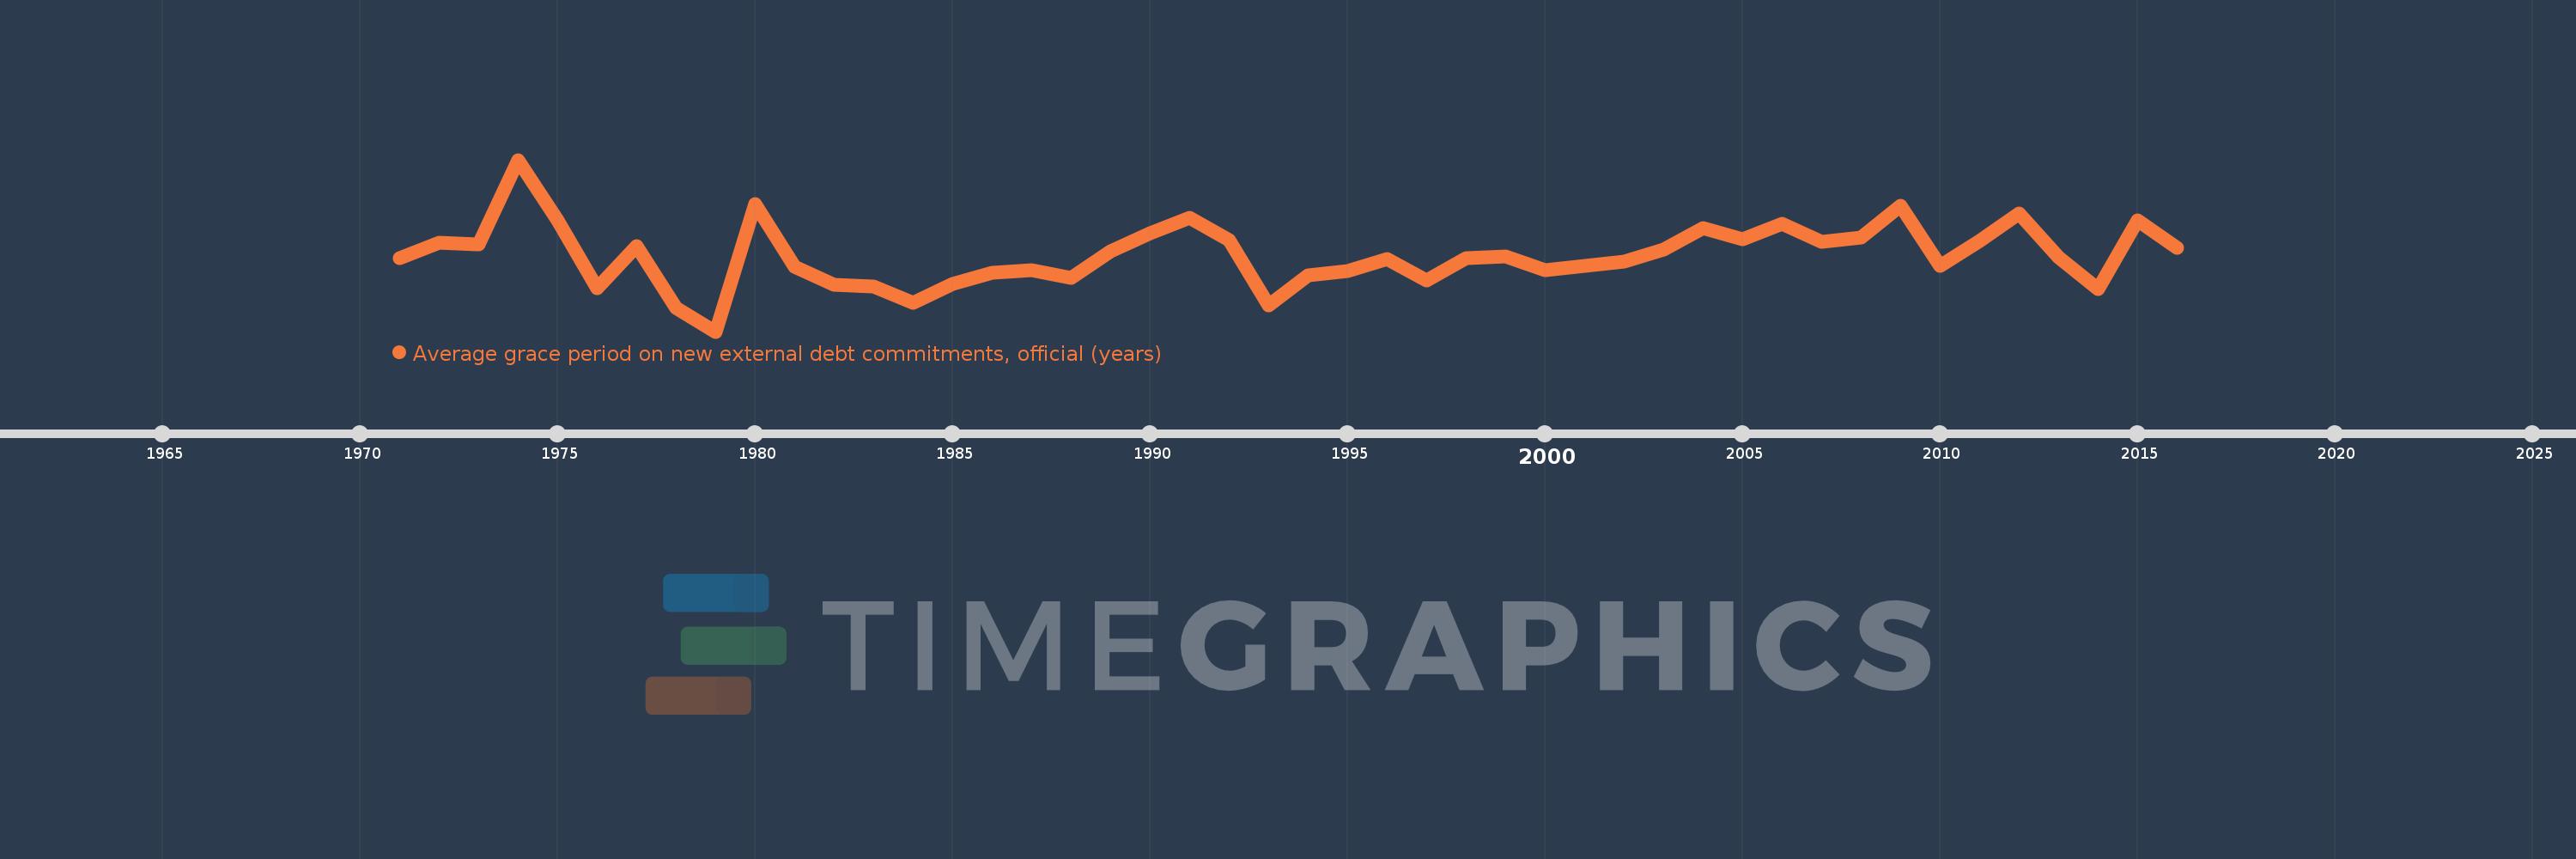
Average grace period on new external debt commitments, official (years)
2016,2015,2014,2013,2012,2011,2010,2009,2008,2007,2006,2005,2004,2003,2002,2001,2000,1999,1998,1997,1996,1995,1994,1993,1992,1991,1990,1989,1988,1987,1986,1985,1984,1983,1982,1981,1980,1979,1978,1977,1976,1975,1974,1973,1972,1971
This statistics in other country:
Timeline:
This timeline shows a graph from 1971 to 2016 of Europe & Central Asia (excluding high income). No data until 1970. Number of actual observations by date: 46.
Source name:
World Development Indicators
Source organization:
World Bank, International Debt Statistics.
Categories, topics:
External Debt
Last updated:
apr 23, 2017
Indicators value changes by year
At the date of observation
Value
Absolute change
Change from previous value
jan 1, 1971
5.416
+5.416
0.0%
jan 1, 1972
5.859
+0.444
8.19%
jan 1, 1973
5.826
-0.033
-0.56%
jan 1, 1974
8.244
+2.417
41.49%
jan 1, 1975
6.519
-1.725
-20.92%
jan 1, 1976
4.561
-1.958
-30.03%
jan 1, 1977
5.783
+1.222
26.78%
jan 1, 1978
3.989
-1.793
-31.01%
jan 1, 1979
3.324
-0.665
-16.66%
jan 1, 1980
6.975
+3.65
109.8%
jan 1, 1981
5.181
-1.794
-25.72%
jan 1, 1982
4.657
-0.524
-10.11%
jan 1, 1983
4.625
-0.032
-0.69%
jan 1, 1984
4.143
-0.482
-10.41%
jan 1, 1985
4.685
+0.541
13.07%
jan 1, 1986
5.009
+0.324
6.92%
jan 1, 1987
5.083
+0.074
1.47%
jan 1, 1988
4.859
-0.223
-4.4%
jan 1, 1989
5.631
+0.771
15.87%
jan 1, 1990
6.147
+0.516
9.17%
jan 1, 1991
6.586
+0.439
7.15%
jan 1, 1992
5.933
-0.654
-9.92%
jan 1, 1993
4.064
-1.868
-31.49%
jan 1, 1994
4.928
+0.864
21.25%
jan 1, 1995
5.06
+0.132
2.68%
jan 1, 1996
5.414
+0.354
7.0%
jan 1, 1997
4.783
-0.631
-11.65%
jan 1, 1998
5.429
+0.645
13.49%
jan 1, 1999
5.465
+0.036
0.66%
jan 1, 2000
5.078
-0.387
-7.08%
jan 1, 2001
5.203
+0.126
2.47%
jan 1, 2002
5.331
+0.128
2.45%
jan 1, 2003
5.684
+0.353
6.62%
jan 1, 2004
6.288
+0.604
10.63%
jan 1, 2005
5.963
-0.325
-5.16%
jan 1, 2006
6.408
+0.445
7.46%
jan 1, 2007
5.901
-0.507
-7.91%
jan 1, 2008
6.013
+0.111
1.89%
jan 1, 2009
6.937
+0.924
15.37%
jan 1, 2010
5.207
-1.73
-24.94%
jan 1, 2011
5.917
+0.71
13.64%
jan 1, 2012
6.715
+0.798
13.48%
jan 1, 2013
5.45
-1.264
-18.83%
jan 1, 2014
4.549
-0.902
-16.54%
jan 1, 2015
6.502
+1.953
42.94%
jan 1, 2016
5.717
-0.785
-12.07%
Ranking of countries by current statistics by years


Comments: