29
/
en
AIzaSyAYiBZKx7MnpbEhh9jyipgxe19OcubqV5w
April 1, 2024
46872
Lower middle income
LMC
false
2
1
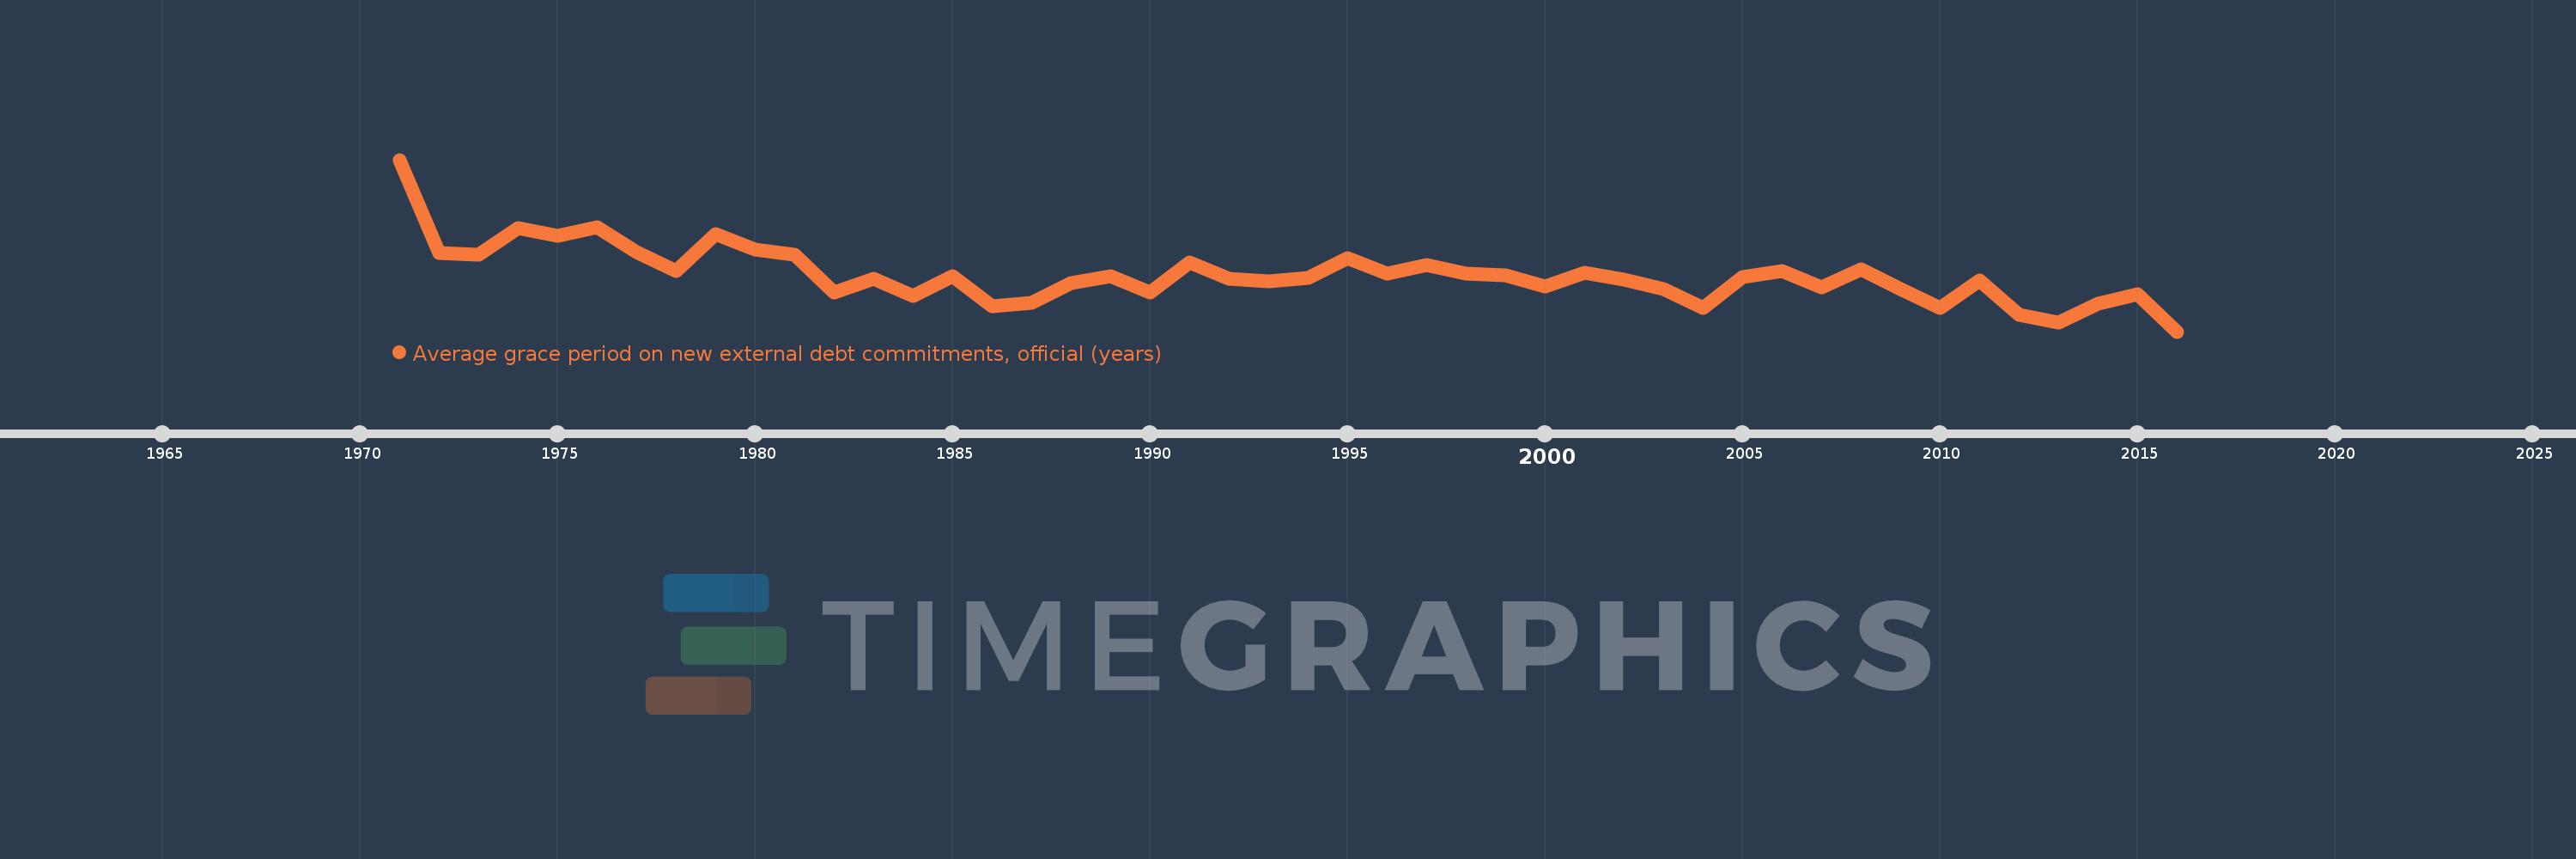
Average grace period on new external debt commitments, official (years)
2016,2015,2014,2013,2012,2011,2010,2009,2008,2007,2006,2005,2004,2003,2002,2001,2000,1999,1998,1997,1996,1995,1994,1993,1992,1991,1990,1989,1988,1987,1986,1985,1984,1983,1982,1981,1980,1979,1978,1977,1976,1975,1974,1973,1972,1971
This statistics in other country:
Timeline:
This timeline shows a graph from 1971 to 2016 of Lower middle income. No data until 1970. Number of actual observations by date: 46.
Source name:
World Development Indicators
Source organization:
World Bank, International Debt Statistics.
Categories, topics:
External Debt
Last updated:
apr 23, 2017
Indicators value changes by year
At the date of observation
Value
Absolute change
Change from previous value
jan 1, 1971
9.831
+9.831
0.0%
jan 1, 1972
7.509
-2.321
-23.61%
jan 1, 1973
7.462
-0.047
-0.63%
jan 1, 1974
8.14
+0.678
9.08%
jan 1, 1975
7.934
-0.206
-2.53%
jan 1, 1976
8.143
+0.209
2.64%
jan 1, 1977
7.531
-0.612
-7.51%
jan 1, 1978
7.053
-0.479
-6.36%
jan 1, 1979
7.985
+0.932
13.22%
jan 1, 1980
7.594
-0.39
-4.89%
jan 1, 1981
7.474
-0.12
-1.58%
jan 1, 1982
6.522
-0.952
-12.74%
jan 1, 1983
6.861
+0.339
5.19%
jan 1, 1984
6.438
-0.423
-6.16%
jan 1, 1985
6.944
+0.506
7.85%
jan 1, 1986
6.178
-0.766
-11.03%
jan 1, 1987
6.262
+0.084
1.35%
jan 1, 1988
6.754
+0.492
7.87%
jan 1, 1989
6.925
+0.171
2.54%
jan 1, 1990
6.518
-0.408
-5.89%
jan 1, 1991
7.282
+0.765
11.73%
jan 1, 1992
6.866
-0.416
-5.71%
jan 1, 1993
6.803
-0.063
-0.92%
jan 1, 1994
6.889
+0.086
1.26%
jan 1, 1995
7.389
+0.5
7.26%
jan 1, 1996
7.0
-0.39
-5.27%
jan 1, 1997
7.205
+0.205
2.93%
jan 1, 1998
6.999
-0.206
-2.85%
jan 1, 1999
6.95
-0.049
-0.69%
jan 1, 2000
6.671
-0.279
-4.02%
jan 1, 2001
7.024
+0.353
5.29%
jan 1, 2002
6.848
-0.176
-2.5%
jan 1, 2003
6.607
-0.241
-3.53%
jan 1, 2004
6.142
-0.465
-7.04%
jan 1, 2005
6.912
+0.771
12.55%
jan 1, 2006
7.051
+0.138
2.0%
jan 1, 2007
6.646
-0.405
-5.74%
jan 1, 2008
7.108
+0.463
6.96%
jan 1, 2009
6.609
-0.499
-7.02%
jan 1, 2010
6.148
-0.462
-6.99%
jan 1, 2011
6.822
+0.674
10.97%
jan 1, 2012
5.97
-0.852
-12.49%
jan 1, 2013
5.768
-0.202
-3.38%
jan 1, 2014
6.24
+0.472
8.19%
jan 1, 2015
6.486
+0.245
3.93%
jan 1, 2016
5.554
-0.932
-14.36%
Ranking of countries by current statistics by years


Comments: