29
/
en
AIzaSyAYiBZKx7MnpbEhh9jyipgxe19OcubqV5w
April 1, 2024
30393
Euro area
EMU
false
2
1
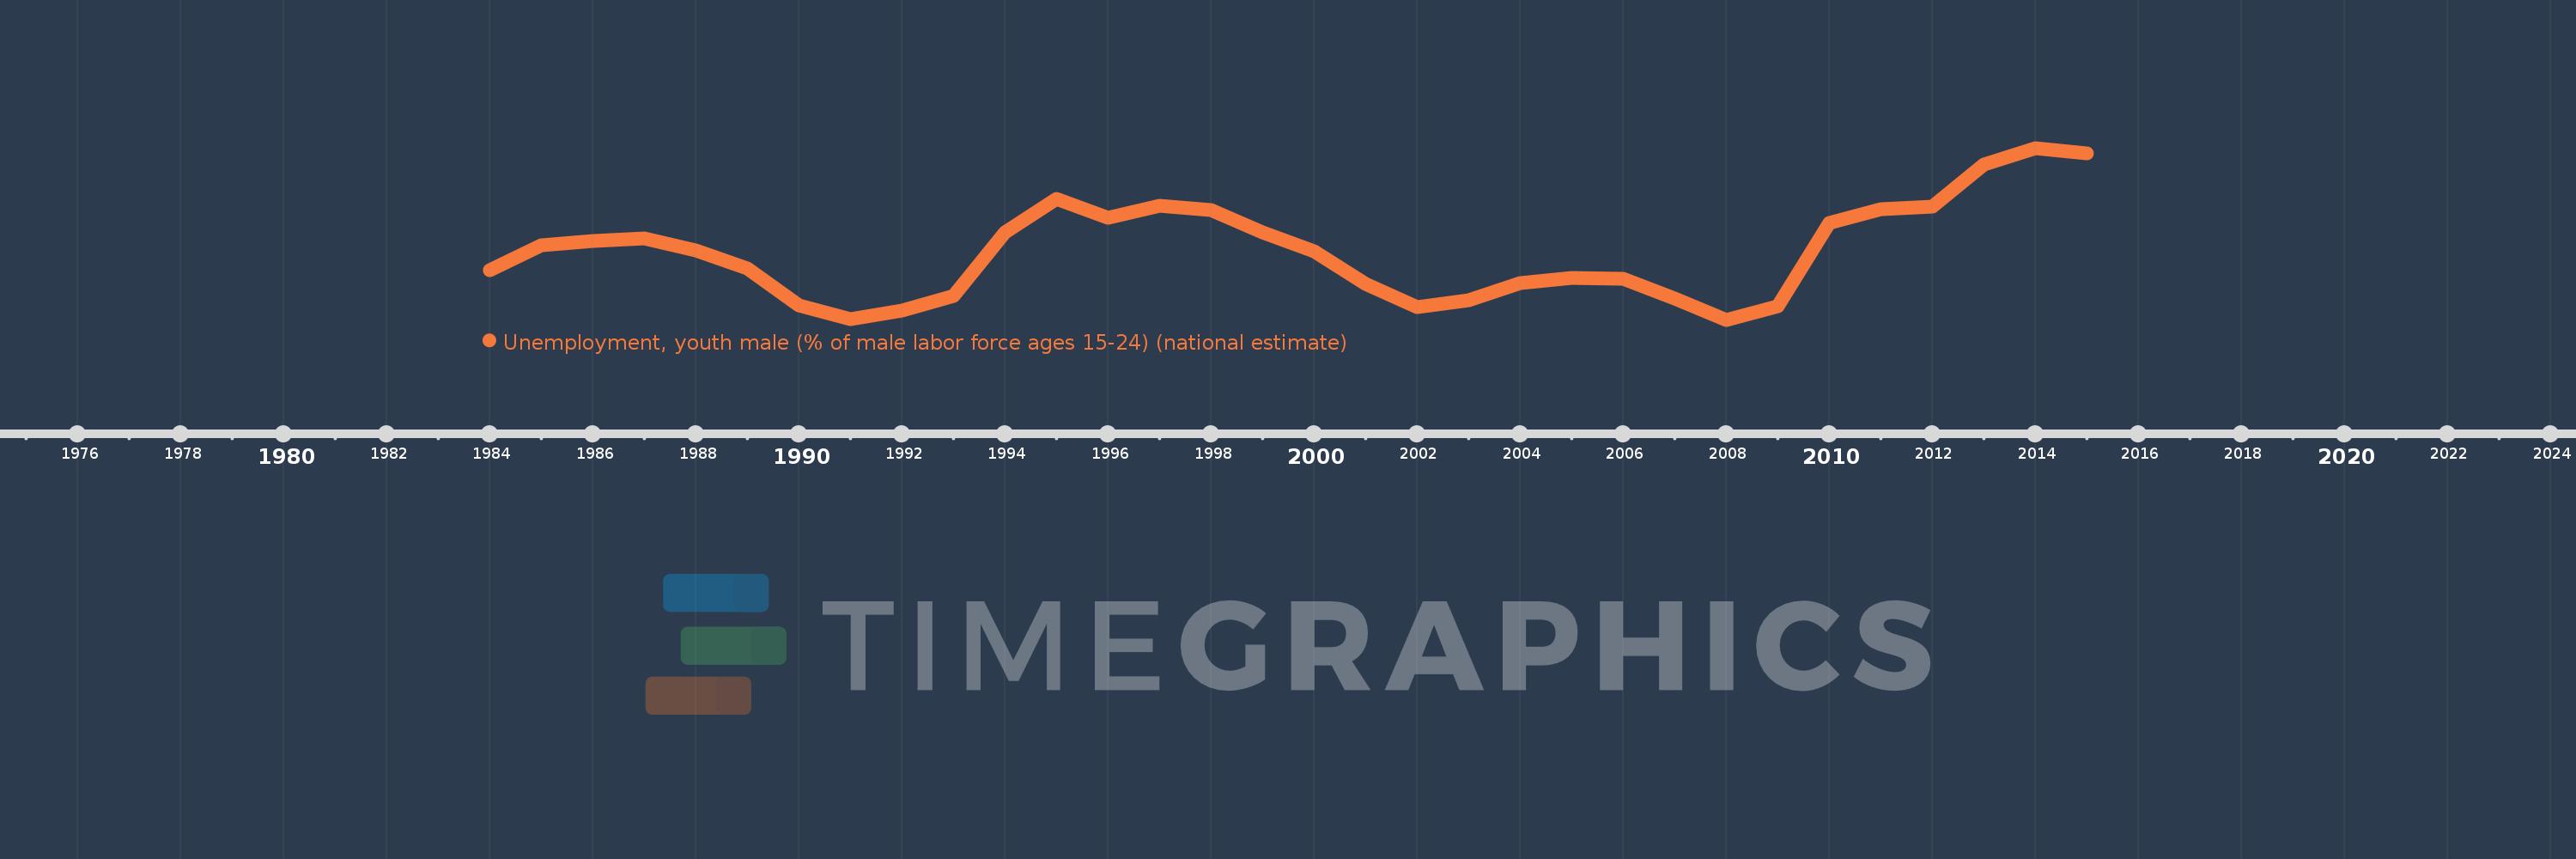
Unemployment, youth male (% of male labor force ages 15-24) (national estimate)
2015,2014,2013,2012,2011,2010,2009,2008,2007,2006,2005,2004,2003,2002,2001,2000,1999,1998,1997,1996,1995,1994,1993,1992,1991,1990,1989,1988,1987,1986,1985,1984
This statistics in other country:
AlbaniaAlgeriaAmerican SamoaAntigua and BarbudaArab WorldArgentinaArmeniaArubaAustraliaAustriaAzerbaijanBahamas, TheBahrainBangladeshBarbadosBelarusBelgiumBelizeBeninBermudaBhutanBoliviaBosnia and HerzegovinaBotswanaBrazilBritish Virgin IslandsBulgariaBurkina FasoBurundiCabo VerdeCambodiaCameroonCanadaCaribbean small statesCayman IslandsCentral Europe and the BalticsChileColombiaCosta RicaCroatiaCubaCyprusCzech RepublicDenmarkDominicaDominican RepublicEarly-demographic dividendEcuadorEgypt, Arab Rep.El SalvadorEstoniaEthiopiaEuro areaEurope & Central AsiaEurope & Central Asia (excluding high income)Europe & Central Asia (IDA & IBRD countries)European UnionFaroe IslandsFijiFinlandFranceFrench PolynesiaGabonGambia, TheGeorgiaGermanyGhanaGreeceGrenadaGuamGuatemalaGuineaGuyanaHaitiHigh incomeHondurasHong Kong SAR, ChinaHungaryIcelandIndiaIndonesiaIran, Islamic Rep.IrelandIsle of ManIsraelItalyJamaicaJapanJordanKazakhstanKiribatiKorea, Rep.KosovoKuwaitKyrgyz RepublicLao PDRLatin America & Caribbean Latin America & Caribbean (excluding high income)Latin America & the Caribbean (IDA & IBRD countries)LatviaLebanonLesothoLiberiaLibyaLithuaniaLower middle incomeLuxembourgMacao SAR, ChinaMacedonia, FYRMadagascarMalawiMalaysiaMaldivesMaliMaltaMarshall IslandsMauritiusMexicoMiddle East & North AfricaMiddle East & North Africa (excluding high income)Middle East & North Africa (IDA & IBRD countries)MoldovaMonacoMongoliaMontenegroMoroccoMozambiqueNamibiaNauruNepalNetherlandsNew ZealandNicaraguaNigerNigeriaNorth AmericaNorthern Mariana IslandsNorwayOECD membersPakistanPalauPanamaParaguayPeruPhilippinesPolandPortugalPost-demographic dividendPuerto RicoQatarRomaniaRussian FederationRwandaSamoaSan MarinoSao Tome and PrincipeSaudi ArabiaSenegalSerbiaSeychellesSierra LeoneSingaporeSlovak RepublicSloveniaSolomon IslandsSouth AfricaSouth AsiaSouth Asia (IDA & IBRD)South SudanSpainSri LankaSt. Kitts and NevisSt. LuciaSt. Vincent and the GrenadinesSudanSurinameSwazilandSwedenSwitzerlandSyrian Arab RepublicTajikistanTanzaniaThailandTimor-LesteTongaTrinidad and TobagoTunisiaTurkeyUgandaUkraineUnited Arab EmiratesUnited KingdomUnited StatesUruguayVanuatuVenezuela, RBVietnamWest Bank and GazaYemen, Rep.ZambiaZimbabwe Timeline:
This timeline shows a graph from 1984 to 2015 of Euro area. No data until 1983. Number of actual observations by date: 32.
Source name:
World Development Indicators
Source organization:
International Labour Organization, Key Indicators of the Labour Market database.
Categories, topics:
Social Protection & Labor
Last updated:
apr 23, 2017
Indicators value changes by year
Minimum:
14.926
jan 1, 2008
At the date of observation
Value
Absolute change
Change from previous value
jan 1, 1984
18.364
+18.364
0.0%
jan 1, 1985
20.149
+1.785
9.72%
jan 1, 1986
20.443
+0.294
1.46%
jan 1, 1987
20.616
+0.172
0.84%
jan 1, 1988
19.77
-0.846
-4.1%
jan 1, 1989
18.517
-1.252
-6.34%
jan 1, 1990
15.93
-2.587
-13.97%
jan 1, 1991
14.947
-0.984
-6.17%
jan 1, 1992
15.538
+0.591
3.95%
jan 1, 1993
16.58
+1.042
6.71%
jan 1, 1994
21.035
+4.455
26.87%
jan 1, 1995
23.336
+2.301
10.94%
jan 1, 1996
22.033
-1.303
-5.58%
jan 1, 1997
22.888
+0.855
3.88%
jan 1, 1998
22.606
-0.282
-1.23%
jan 1, 1999
21.046
-1.56
-6.9%
jan 1, 2000
19.73
-1.316
-6.25%
jan 1, 2001
17.456
-2.274
-11.52%
jan 1, 2002
15.778
-1.679
-9.62%
jan 1, 2003
16.311
+0.534
3.38%
jan 1, 2004
17.483
+1.172
7.18%
jan 1, 2005
17.864
+0.382
2.18%
jan 1, 2006
17.771
-0.093
-0.52%
jan 1, 2007
16.391
-1.381
-7.77%
jan 1, 2008
14.926
-1.464
-8.93%
jan 1, 2009
15.88
+0.953
6.39%
jan 1, 2010
21.7
+5.82
36.65%
jan 1, 2011
22.617
+0.917
4.23%
jan 1, 2012
22.799
+0.182
0.81%
jan 1, 2013
25.739
+2.94
12.89%
jan 1, 2014
26.92
+1.181
4.59%
jan 1, 2015
26.554
-0.366
-1.36%
Ranking of countries by current statistics by years


Comments: