29
/
en
AIzaSyAYiBZKx7MnpbEhh9jyipgxe19OcubqV5w
April 1, 2024
33974
European Union
EUU
false
2
1
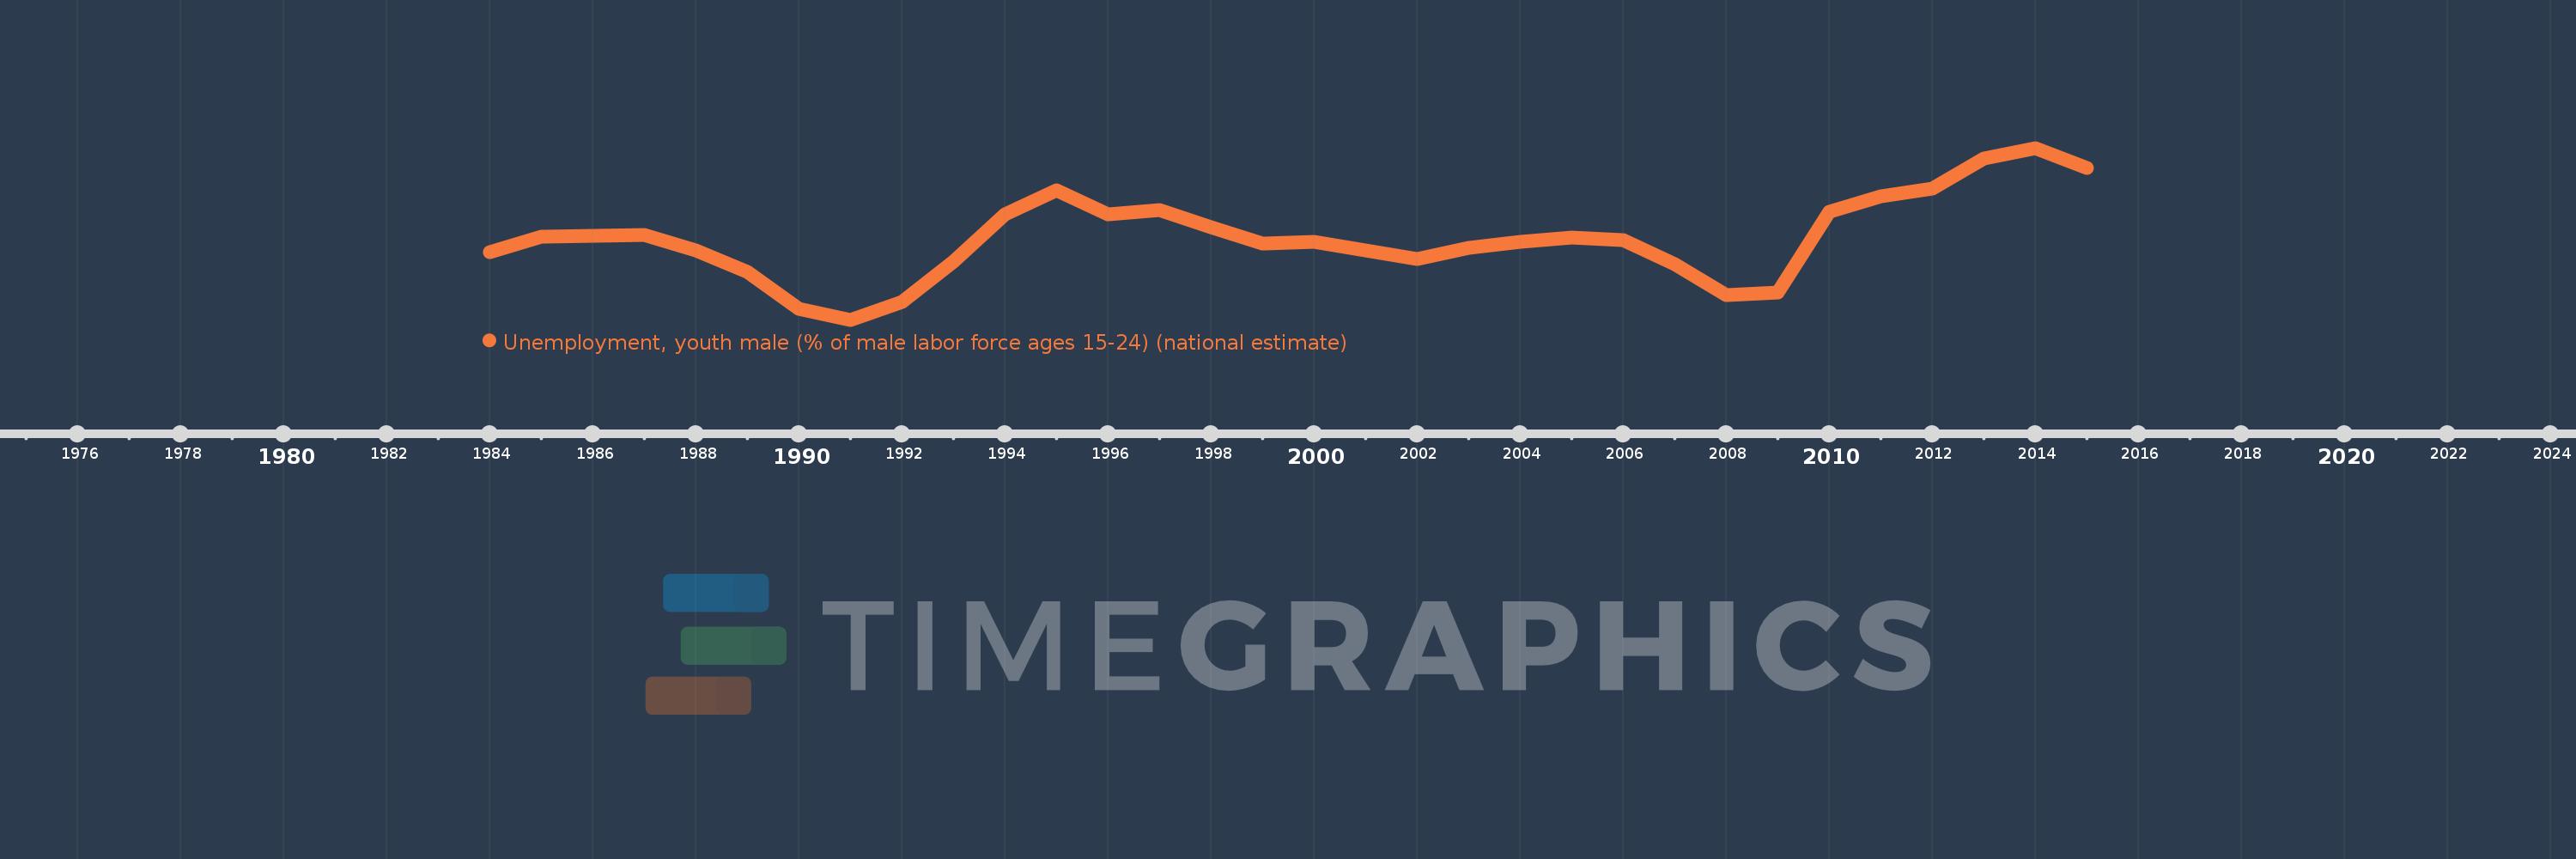
Unemployment, youth male (% of male labor force ages 15-24) (national estimate)
2015,2014,2013,2012,2011,2010,2009,2008,2007,2006,2005,2004,2003,2002,2001,2000,1999,1998,1997,1996,1995,1994,1993,1992,1991,1990,1989,1988,1987,1986,1985,1984
This statistics in other country:
AlbaniaAlgeriaAmerican SamoaAntigua and BarbudaArab WorldArgentinaArmeniaArubaAustraliaAustriaAzerbaijanBahamas, TheBahrainBangladeshBarbadosBelarusBelgiumBelizeBeninBermudaBhutanBoliviaBosnia and HerzegovinaBotswanaBrazilBritish Virgin IslandsBulgariaBurkina FasoBurundiCabo VerdeCambodiaCameroonCanadaCaribbean small statesCayman IslandsCentral Europe and the BalticsChileColombiaCosta RicaCroatiaCubaCyprusCzech RepublicDenmarkDominicaDominican RepublicEarly-demographic dividendEcuadorEgypt, Arab Rep.El SalvadorEstoniaEthiopiaEuro areaEurope & Central AsiaEurope & Central Asia (excluding high income)Europe & Central Asia (IDA & IBRD countries)European UnionFaroe IslandsFijiFinlandFranceFrench PolynesiaGabonGambia, TheGeorgiaGermanyGhanaGreeceGrenadaGuamGuatemalaGuineaGuyanaHaitiHigh incomeHondurasHong Kong SAR, ChinaHungaryIcelandIndiaIndonesiaIran, Islamic Rep.IrelandIsle of ManIsraelItalyJamaicaJapanJordanKazakhstanKiribatiKorea, Rep.KosovoKuwaitKyrgyz RepublicLao PDRLatin America & Caribbean Latin America & Caribbean (excluding high income)Latin America & the Caribbean (IDA & IBRD countries)LatviaLebanonLesothoLiberiaLibyaLithuaniaLower middle incomeLuxembourgMacao SAR, ChinaMacedonia, FYRMadagascarMalawiMalaysiaMaldivesMaliMaltaMarshall IslandsMauritiusMexicoMiddle East & North AfricaMiddle East & North Africa (excluding high income)Middle East & North Africa (IDA & IBRD countries)MoldovaMonacoMongoliaMontenegroMoroccoMozambiqueNamibiaNauruNepalNetherlandsNew ZealandNicaraguaNigerNigeriaNorth AmericaNorthern Mariana IslandsNorwayOECD membersPakistanPalauPanamaParaguayPeruPhilippinesPolandPortugalPost-demographic dividendPuerto RicoQatarRomaniaRussian FederationRwandaSamoaSan MarinoSao Tome and PrincipeSaudi ArabiaSenegalSerbiaSeychellesSierra LeoneSingaporeSlovak RepublicSloveniaSolomon IslandsSouth AfricaSouth AsiaSouth Asia (IDA & IBRD)South SudanSpainSri LankaSt. Kitts and NevisSt. LuciaSt. Vincent and the GrenadinesSudanSurinameSwazilandSwedenSwitzerlandSyrian Arab RepublicTajikistanTanzaniaThailandTimor-LesteTongaTrinidad and TobagoTunisiaTurkeyUgandaUkraineUnited Arab EmiratesUnited KingdomUnited StatesUruguayVanuatuVenezuela, RBVietnamWest Bank and GazaYemen, Rep.ZambiaZimbabwe Timeline:
This timeline shows a graph from 1984 to 2015 of European Union. No data until 1983. Number of actual observations by date: 32.
Source name:
World Development Indicators
Source organization:
International Labour Organization, Key Indicators of the Labour Market database.
Categories, topics:
Social Protection & Labor
Last updated:
apr 23, 2017
Indicators value changes by year
Minimum:
14.135
jan 1, 1991
Maximum:
25.926
jan 1, 2014
At the date of observation
Value
Absolute change
Change from previous value
jan 1, 1984
18.788
+18.788
0.0%
jan 1, 1985
19.848
+1.06
5.64%
jan 1, 1986
19.875
+0.027
0.14%
jan 1, 1987
19.97
+0.095
0.48%
jan 1, 1988
18.905
-1.065
-5.33%
jan 1, 1989
17.411
-1.494
-7.9%
jan 1, 1990
14.871
-2.54
-14.59%
jan 1, 1991
14.135
-0.736
-4.95%
jan 1, 1992
15.373
+1.239
8.76%
jan 1, 1993
18.105
+2.732
17.77%
jan 1, 1994
21.396
+3.291
18.18%
jan 1, 1995
23.017
+1.621
7.57%
jan 1, 1996
21.396
-1.62
-7.04%
jan 1, 1997
21.67
+0.274
1.28%
jan 1, 1998
20.498
-1.173
-5.41%
jan 1, 1999
19.352
-1.146
-5.59%
jan 1, 2000
19.509
+0.157
0.81%
jan 1, 2001
18.878
-0.63
-3.23%
jan 1, 2002
18.283
-0.596
-3.15%
jan 1, 2003
19.085
+0.802
4.39%
jan 1, 2004
19.505
+0.421
2.2%
jan 1, 2005
19.801
+0.296
1.52%
jan 1, 2006
19.587
-0.214
-1.08%
jan 1, 2007
17.956
-1.632
-8.33%
jan 1, 2008
15.841
-2.115
-11.78%
jan 1, 2009
16.025
+0.184
1.16%
jan 1, 2010
21.546
+5.521
34.46%
jan 1, 2011
22.596
+1.05
4.87%
jan 1, 2012
23.137
+0.542
2.4%
jan 1, 2013
25.182
+2.045
8.84%
jan 1, 2014
25.926
+0.744
2.95%
jan 1, 2015
24.57
-1.356
-5.23%
Ranking of countries by current statistics by years


Comments: