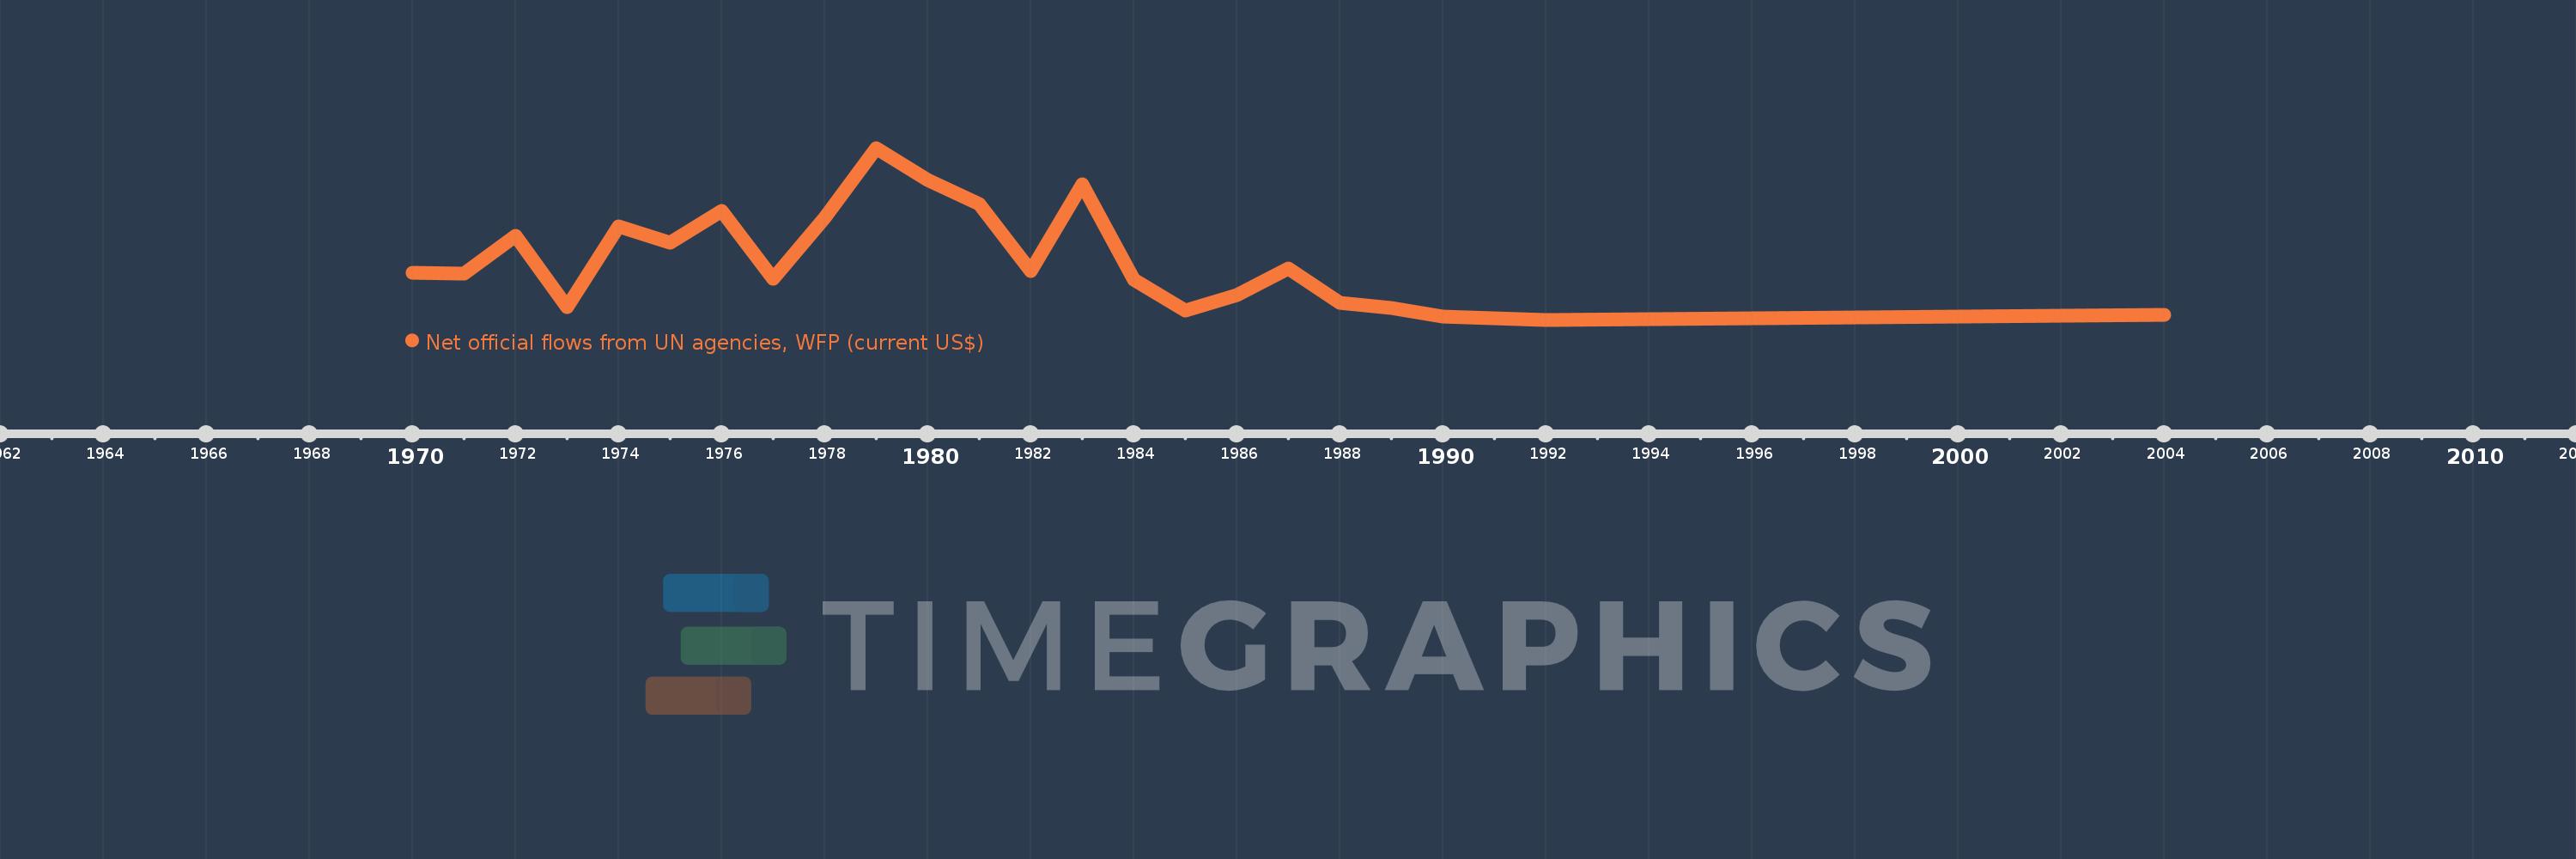
This timeline shows a graph from 1970 to 2004 of Euro area. No data until 1969. Number of actual observations by date: 23.
Source name:
World Development Indicators
Source organization:
Development Assistance Committee of the Organisation for Economic Co-operation and Development, Geographical Distribution of Financial Flows to Developing Countries, Development Co-operation Report, and International Development Statistics database. Data are available online at: www.oecd.org/dac/stats/idsonline.
Categories, topics:
Aid Effectiveness
Last updated:
apr 23, 2017
Indicators value changes by year
Meaning:
1.937 mln
Minimum:
-100.0K
jan 1, 1992
Maximum:
5.71 mln
jan 1, 1979
At the date of observation
Value
Absolute change
Change from the previous value
jan 1, 1970
1.49 mln
+1.49 mln
0.0%
jan 1, 1971
1.45 mln
-40.0K
-2.68%
jan 1, 1972
2.74 mln
+1.29 mln
88.97%
jan 1, 1973
340.0K
-2.4 mln
-87.59%
jan 1, 1974
3.05 mln
+2.71 mln
797.06%
jan 1, 1975
2.52 mln
-530.0K
-17.38%
jan 1, 1976
3.57 mln
+1.05 mln
41.67%
jan 1, 1977
1.29 mln
-2.28 mln
-63.87%
jan 1, 1978
3.36 mln
+2.07 mln
160.47%
jan 1, 1979
5.71 mln
+2.35 mln
69.94%
jan 1, 1980
4.62 mln
-1.09 mln
-19.09%
jan 1, 1981
3.8 mln
-820.0K
-17.75%
jan 1, 1982
1.54 mln
-2.26 mln
-59.47%
jan 1, 1983
4.49 mln
+2.95 mln
191.56%
jan 1, 1984
1.25 mln
-3.24 mln
-72.16%
jan 1, 1985
220.0K
-1.03 mln
-82.4%
jan 1, 1986
740.0K
+520.0K
236.36%
jan 1, 1987
1.63 mln
+890.0K
120.27%
jan 1, 1988
480.0K
-1.15 mln
-70.55%
jan 1, 1989
290.0K
-190.0K
-39.58%
jan 1, 1990
20.0K
-270.0K
-93.1%
jan 1, 1992
-100.0K
-120.0K
-600.0%
jan 1, 2004
60.0K
+160.0K
-160.0%
Ranking of countries by current statistics by years
