29
/
en
AIzaSyAYiBZKx7MnpbEhh9jyipgxe19OcubqV5w
April 1, 2024
186915
Malawi
MWI
true
2
1
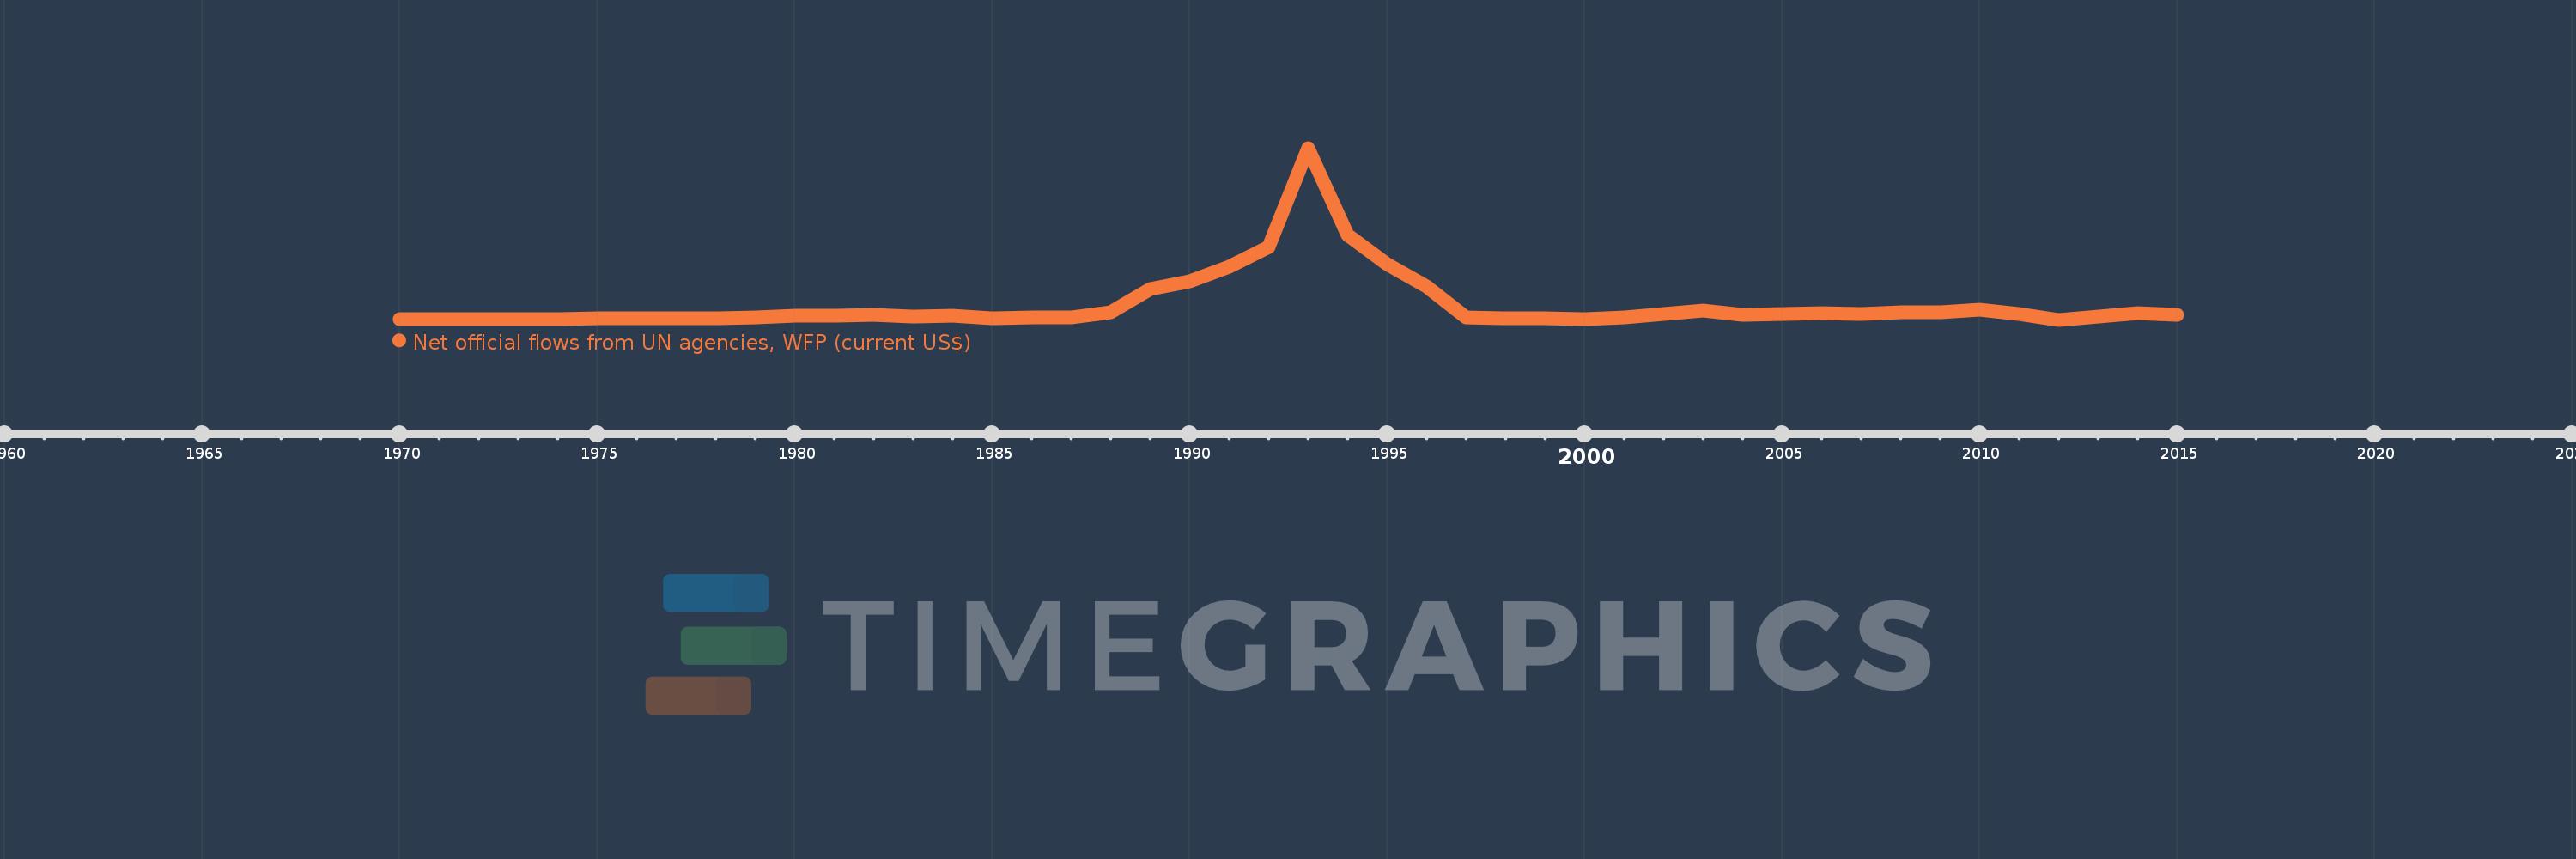
Net official flows from UN agencies, WFP (current US$)
2015,2014,2013,2012,2011,2010,2009,2008,2007,2006,2005,2004,2003,2002,2001,2000,1999,1998,1997,1996,1995,1994,1993,1992,1991,1990,1989,1988,1987,1986,1985,1984,1983,1982,1981,1980,1979,1978,1977,1976,1975,1974,1973,1972,1971,1970
This statistics in other country:
AfghanistanAlbaniaAlgeriaAngolaAntigua and BarbudaArab WorldArgentinaArmeniaAzerbaijanBangladeshBarbadosBelizeBeninBhutanBoliviaBosnia and HerzegovinaBotswanaBrazilBulgariaBurkina FasoBurundiCabo VerdeCambodiaCameroonCaribbean small statesCentral African RepublicCentral Europe and the BalticsChadChileChinaColombiaComorosCongo, Dem. Rep.Congo, Rep.Costa RicaCote d'IvoireCubaCyprusDjiboutiDominicaDominican RepublicEast Asia & PacificEast Asia & Pacific (excluding high income)East Asia & Pacific (IDA & IBRD countries)EcuadorEgypt, Arab Rep.El SalvadorEquatorial GuineaEritreaEstoniaEthiopiaEuro areaEurope & Central AsiaEurope & Central Asia (excluding high income)Europe & Central Asia (IDA & IBRD countries)European UnionFijiFragile and conflict affected situationsGabonGambia, TheGeorgiaGhanaGrenadaGuatemalaGuineaGuinea-BissauGuyanaHaitiHeavily indebted poor countries (HIPC)High incomeHondurasIBRD onlyIDA & IBRD totalIDA blendIDA onlyIDA totalIndiaIndonesiaIran, Islamic Rep.IraqJamaicaJordanKenyaKorea, Dem. People’s Rep.Korea, Rep.KuwaitKyrgyz RepublicLao PDRLatin America & Caribbean Latin America & Caribbean (excluding high income)Latin America & the Caribbean (IDA & IBRD countries)Least developed countries: UN classificationLebanonLesothoLiberiaLibyaLow & middle incomeLow incomeLower middle incomeMacedonia, FYRMadagascarMalawiMalaysiaMaldivesMaliMaltaMauritaniaMauritiusMexicoMiddle East & North AfricaMiddle East & North Africa (excluding high income)Middle East & North Africa (IDA & IBRD countries)Middle incomeMoldovaMongoliaMoroccoMozambiqueMyanmarNamibiaNepalNicaraguaNigerNigeriaOECD membersOmanOther small statesPacific island small statesPakistanPanamaPapua New GuineaParaguayPeruPhilippinesPolandRomaniaRussian FederationRwandaSamoaSao Tome and PrincipeSenegalSerbiaSeychellesSierra LeoneSingaporeSmall statesSolomon IslandsSomaliaSouth AfricaSouth AsiaSouth Asia (IDA & IBRD)South SudanSri LankaSt. Kitts and NevisSt. LuciaSt. Vincent and the GrenadinesSub-Saharan Africa Sub-Saharan Africa (excluding high income)Sub-Saharan Africa (IDA & IBRD countries)SudanSurinameSwazilandSyrian Arab RepublicTajikistanTanzaniaThailandTimor-LesteTogoTongaTrinidad and TobagoTunisiaTurkeyTurkmenistanUgandaUnited Arab EmiratesUpper middle incomeUruguayVanuatuVenezuela, RBVietnamWest Bank and GazaWorldYemen, Rep.ZambiaZimbabwe Timeline:
This timeline shows a graph from 1970 to 2015 of Malawi. No data until 1969. Number of actual observations by date: 46.
Source name:
World Development Indicators
Source organization:
Development Assistance Committee of the Organisation for Economic Co-operation and Development, Geographical Distribution of Financial Flows to Developing Countries, Development Co-operation Report, and International Development Statistics database. Data are available online at: www.oecd.org/dac/stats/idsonline.
Categories, topics:
Aid Effectiveness
Last updated:
apr 23, 2017
Indicators value changes by year
Minimum:
-150.0K
jan 1, 2012
Maximum:
139.93 mln
jan 1, 1993
At the date of observation
Value
Absolute change
Change from previous value
jan 1, 1970
70.0K
+70.0K
0.0%
jan 1, 1971
70.0K
0.0
0.0%
jan 1, 1972
280.0K
+210.0K
300.0%
jan 1, 1973
90.0K
-190.0K
-67.86%
jan 1, 1974
440.0K
+350.0K
388.89%
jan 1, 1975
700.0K
+260.0K
59.09%
jan 1, 1976
1.21 mln
+510.0K
72.86%
jan 1, 1977
1.2 mln
-10.0K
-0.83%
jan 1, 1978
1.39 mln
+190.0K
15.83%
jan 1, 1979
1.98 mln
+590.0K
42.45%
jan 1, 1980
3.12 mln
+1.14 mln
57.58%
jan 1, 1981
3.21 mln
+90.0K
2.88%
jan 1, 1982
3.8 mln
+590.0K
18.38%
jan 1, 1983
2.46 mln
-1.34 mln
-35.26%
jan 1, 1984
2.85 mln
+390.0K
15.85%
jan 1, 1985
1.16 mln
-1.69 mln
-59.3%
jan 1, 1986
1.59 mln
+430.0K
37.07%
jan 1, 1987
1.57 mln
-20.0K
-1.26%
jan 1, 1988
6.17 mln
+4.6 mln
292.99%
jan 1, 1989
24.98 mln
+18.81 mln
304.86%
jan 1, 1990
31.2 mln
+6.22 mln
24.9%
jan 1, 1991
43.34 mln
+12.14 mln
38.91%
jan 1, 1992
59.28 mln
+15.94 mln
36.78%
jan 1, 1993
139.93 mln
+80.65 mln
136.05%
jan 1, 1994
68.91 mln
-71.02 mln
-50.75%
jan 1, 1995
45.48 mln
-23.43 mln
-34.0%
jan 1, 1996
26.92 mln
-18.56 mln
-40.81%
jan 1, 1997
1.6 mln
-25.32 mln
-94.06%
jan 1, 1998
960.0K
-640.0K
-40.0%
jan 1, 1999
790.0K
-170.0K
-17.71%
jan 1, 2000
530.0K
-260.0K
-32.91%
jan 1, 2001
1.77 mln
+1.24 mln
233.96%
jan 1, 2002
4.42 mln
+2.65 mln
149.72%
jan 1, 2003
7.0 mln
+2.58 mln
58.37%
jan 1, 2004
4.18 mln
-2.82 mln
-40.29%
jan 1, 2005
4.87 mln
+690.0K
16.51%
jan 1, 2006
5.5 mln
+630.0K
12.94%
jan 1, 2007
4.41 mln
-1.09 mln
-19.82%
jan 1, 2008
6.02 mln
+1.61 mln
36.51%
jan 1, 2009
6.27 mln
+250.0K
4.15%
jan 1, 2010
7.7 mln
+1.43 mln
22.81%
jan 1, 2011
4.41 mln
-3.29 mln
-42.73%
jan 1, 2012
-150.0K
-4.56 mln
-103.4%
jan 1, 2013
2.69 mln
+2.84 mln
-1.89K%
jan 1, 2014
5.51 mln
+2.82 mln
104.83%
jan 1, 2015
3.58 mln
-1.93 mln
-35.03%
Ranking of countries by current statistics by years


Comments: