29
/
en
AIzaSyAYiBZKx7MnpbEhh9jyipgxe19OcubqV5w
April 1, 2024
30000
Euro area
EMU
false
2
1
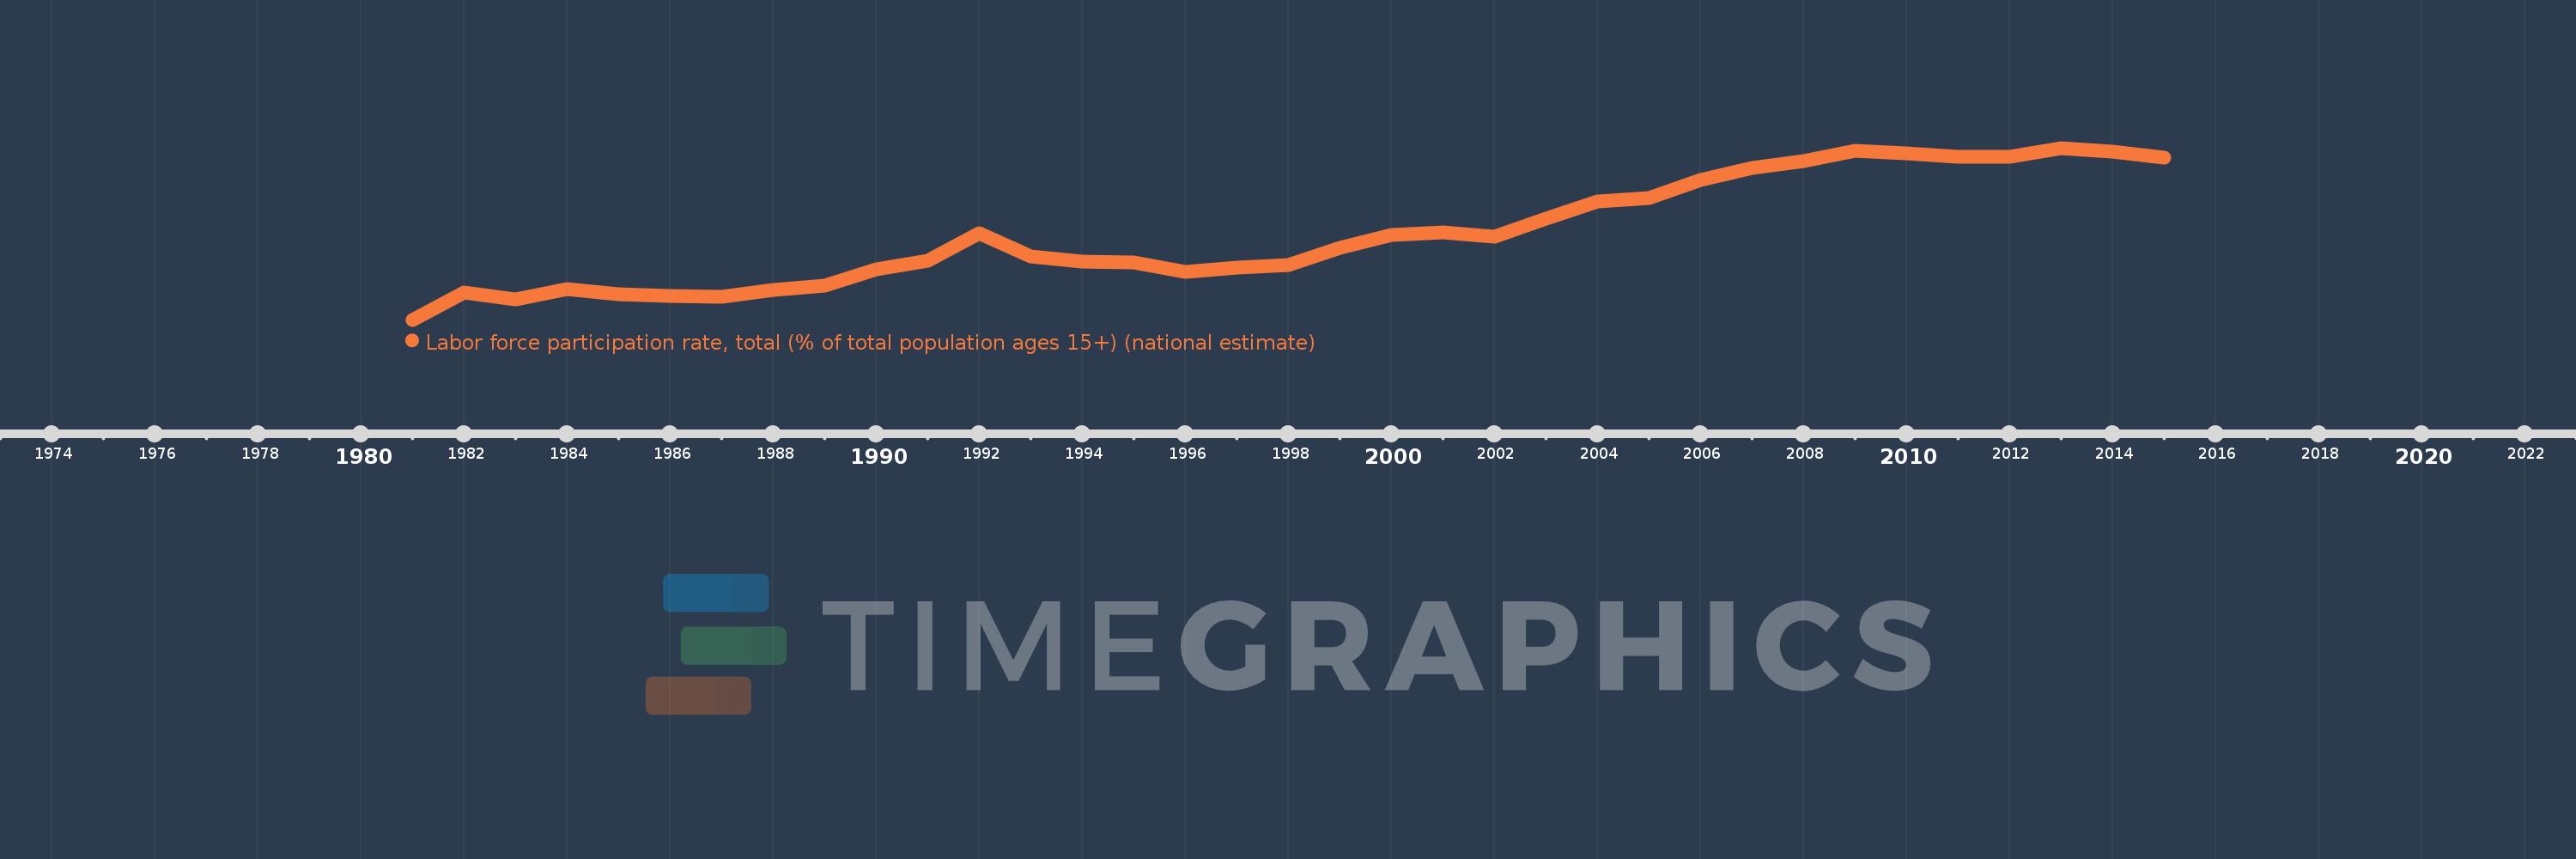
Labor force participation rate, total (% of total population ages 15+) (national estimate)
2015,2014,2013,2012,2011,2010,2009,2008,2007,2006,2005,2004,2003,2002,2001,2000,1999,1998,1997,1996,1995,1994,1993,1992,1991,1990,1989,1988,1987,1986,1985,1984,1983,1982,1981
This statistics in other country:
AfghanistanAlbaniaAlgeriaAmerican SamoaAntigua and BarbudaArab WorldArgentinaArmeniaArubaAustraliaAustriaAzerbaijanBahamas, TheBahrainBangladeshBarbadosBelarusBelgiumBelizeBeninBermudaBhutanBoliviaBosnia and HerzegovinaBotswanaBrazilBritish Virgin IslandsBrunei DarussalamBulgariaBurkina FasoBurundiCabo VerdeCambodiaCameroonCanadaCaribbean small statesCayman IslandsCentral African RepublicCentral Europe and the BalticsChadChileChinaColombiaComorosCongo, Dem. Rep.Congo, Rep.Costa RicaCote d'IvoireCroatiaCubaCyprusCzech RepublicDenmarkDjiboutiDominicaDominican RepublicEarly-demographic dividendEast Asia & PacificEast Asia & Pacific (excluding high income)East Asia & Pacific (IDA & IBRD countries)EcuadorEgypt, Arab Rep.El SalvadorEquatorial GuineaEstoniaEthiopiaEuro areaEurope & Central AsiaEurope & Central Asia (excluding high income)Europe & Central Asia (IDA & IBRD countries)European UnionFaroe IslandsFijiFinlandFranceFrench PolynesiaGabonGambia, TheGeorgiaGermanyGhanaGibraltarGreeceGrenadaGuamGuatemalaGuineaGuyanaHaitiHigh incomeHondurasHong Kong SAR, ChinaHungaryIBRD onlyIcelandIDA & IBRD totalIDA blendIndiaIndonesiaIran, Islamic Rep.IraqIrelandIsle of ManIsraelItalyJamaicaJapanJordanKazakhstanKenyaKiribatiKorea, Rep.KosovoKuwaitKyrgyz RepublicLao PDRLate-demographic dividendLatin America & Caribbean Latin America & Caribbean (excluding high income)Latin America & the Caribbean (IDA & IBRD countries)LatviaLebanonLesothoLiberiaLibyaLiechtensteinLithuaniaLow & middle incomeLower middle incomeLuxembourgMacao SAR, ChinaMacedonia, FYRMadagascarMalawiMalaysiaMaldivesMaliMaltaMarshall IslandsMauritaniaMauritiusMexicoMiddle East & North AfricaMiddle East & North Africa (excluding high income)Middle East & North Africa (IDA & IBRD countries)Middle incomeMoldovaMonacoMongoliaMontenegroMoroccoMozambiqueMyanmarNamibiaNauruNepalNetherlandsNew CaledoniaNew ZealandNicaraguaNigerNigeriaNorth AmericaNorthern Mariana IslandsNorwayOECD membersOmanPacific island small statesPakistanPalauPanamaPapua New GuineaParaguayPeruPhilippinesPolandPortugalPost-demographic dividendPuerto RicoQatarRomaniaRussian FederationRwandaSamoaSan MarinoSao Tome and PrincipeSaudi ArabiaSenegalSerbiaSeychellesSierra LeoneSingaporeSlovak RepublicSloveniaSolomon IslandsSouth AfricaSouth AsiaSouth Asia (IDA & IBRD)South SudanSpainSri LankaSt. Kitts and NevisSt. LuciaSt. Vincent and the GrenadinesSudanSurinameSwazilandSwedenSwitzerlandSyrian Arab RepublicTajikistanTanzaniaThailandTimor-LesteTogoTongaTrinidad and TobagoTunisiaTurkeyTurkmenistanTurks and Caicos IslandsTuvaluUgandaUkraineUnited Arab EmiratesUnited KingdomUnited StatesUpper middle incomeUruguayVanuatuVenezuela, RBVietnamVirgin Islands (U.S.)West Bank and GazaWorldYemen, Rep.ZambiaZimbabwe Timeline:
This timeline shows a graph from 1981 to 2015 of Euro area. No data until 1980. Number of actual observations by date: 35.
Source name:
World Development Indicators
Source organization:
International Labour Organization, Key Indicators of the Labour Market database.
Categories, topics:
Social Protection & Labor
Last updated:
apr 23, 2017
Indicators value changes by year
Minimum:
52.786
jan 1, 1981
At the date of observation
Value
Absolute change
Change from previous value
jan 1, 1981
52.786
+52.786
0.0%
jan 1, 1982
53.479
+0.693
1.31%
jan 1, 1983
53.296
-0.184
-0.34%
jan 1, 1984
53.565
+0.27
0.51%
jan 1, 1985
53.448
-0.117
-0.22%
jan 1, 1986
53.392
-0.056
-0.11%
jan 1, 1987
53.371
-0.021
-0.04%
jan 1, 1988
53.548
+0.177
0.33%
jan 1, 1989
53.654
+0.106
0.2%
jan 1, 1990
54.073
+0.419
0.78%
jan 1, 1991
54.297
+0.224
0.41%
jan 1, 1992
54.995
+0.698
1.29%
jan 1, 1993
54.41
-0.585
-1.06%
jan 1, 1994
54.267
-0.143
-0.26%
jan 1, 1995
54.259
-0.007
-0.01%
jan 1, 1996
54.001
-0.258
-0.48%
jan 1, 1997
54.117
+0.116
0.21%
jan 1, 1998
54.18
+0.063
0.12%
jan 1, 1999
54.621
+0.441
0.81%
jan 1, 2000
54.95
+0.329
0.6%
jan 1, 2001
55.029
+0.079
0.14%
jan 1, 2002
54.906
-0.123
-0.22%
jan 1, 2003
55.382
+0.476
0.87%
jan 1, 2004
55.803
+0.421
0.76%
jan 1, 2005
55.906
+0.103
0.18%
jan 1, 2006
56.356
+0.45
0.8%
jan 1, 2007
56.662
+0.306
0.54%
jan 1, 2008
56.853
+0.191
0.34%
jan 1, 2009
57.109
+0.256
0.45%
jan 1, 2010
57.051
-0.058
-0.1%
jan 1, 2011
56.946
-0.104
-0.18%
jan 1, 2012
56.955
+0.008
0.01%
jan 1, 2013
57.18
+0.225
0.4%
jan 1, 2014
57.096
-0.084
-0.15%
jan 1, 2015
56.924
-0.172
-0.3%
Ranking of countries by current statistics by years


Comments: