29
/
en
AIzaSyAYiBZKx7MnpbEhh9jyipgxe19OcubqV5w
April 1, 2024
33572
European Union
EUU
false
2
1
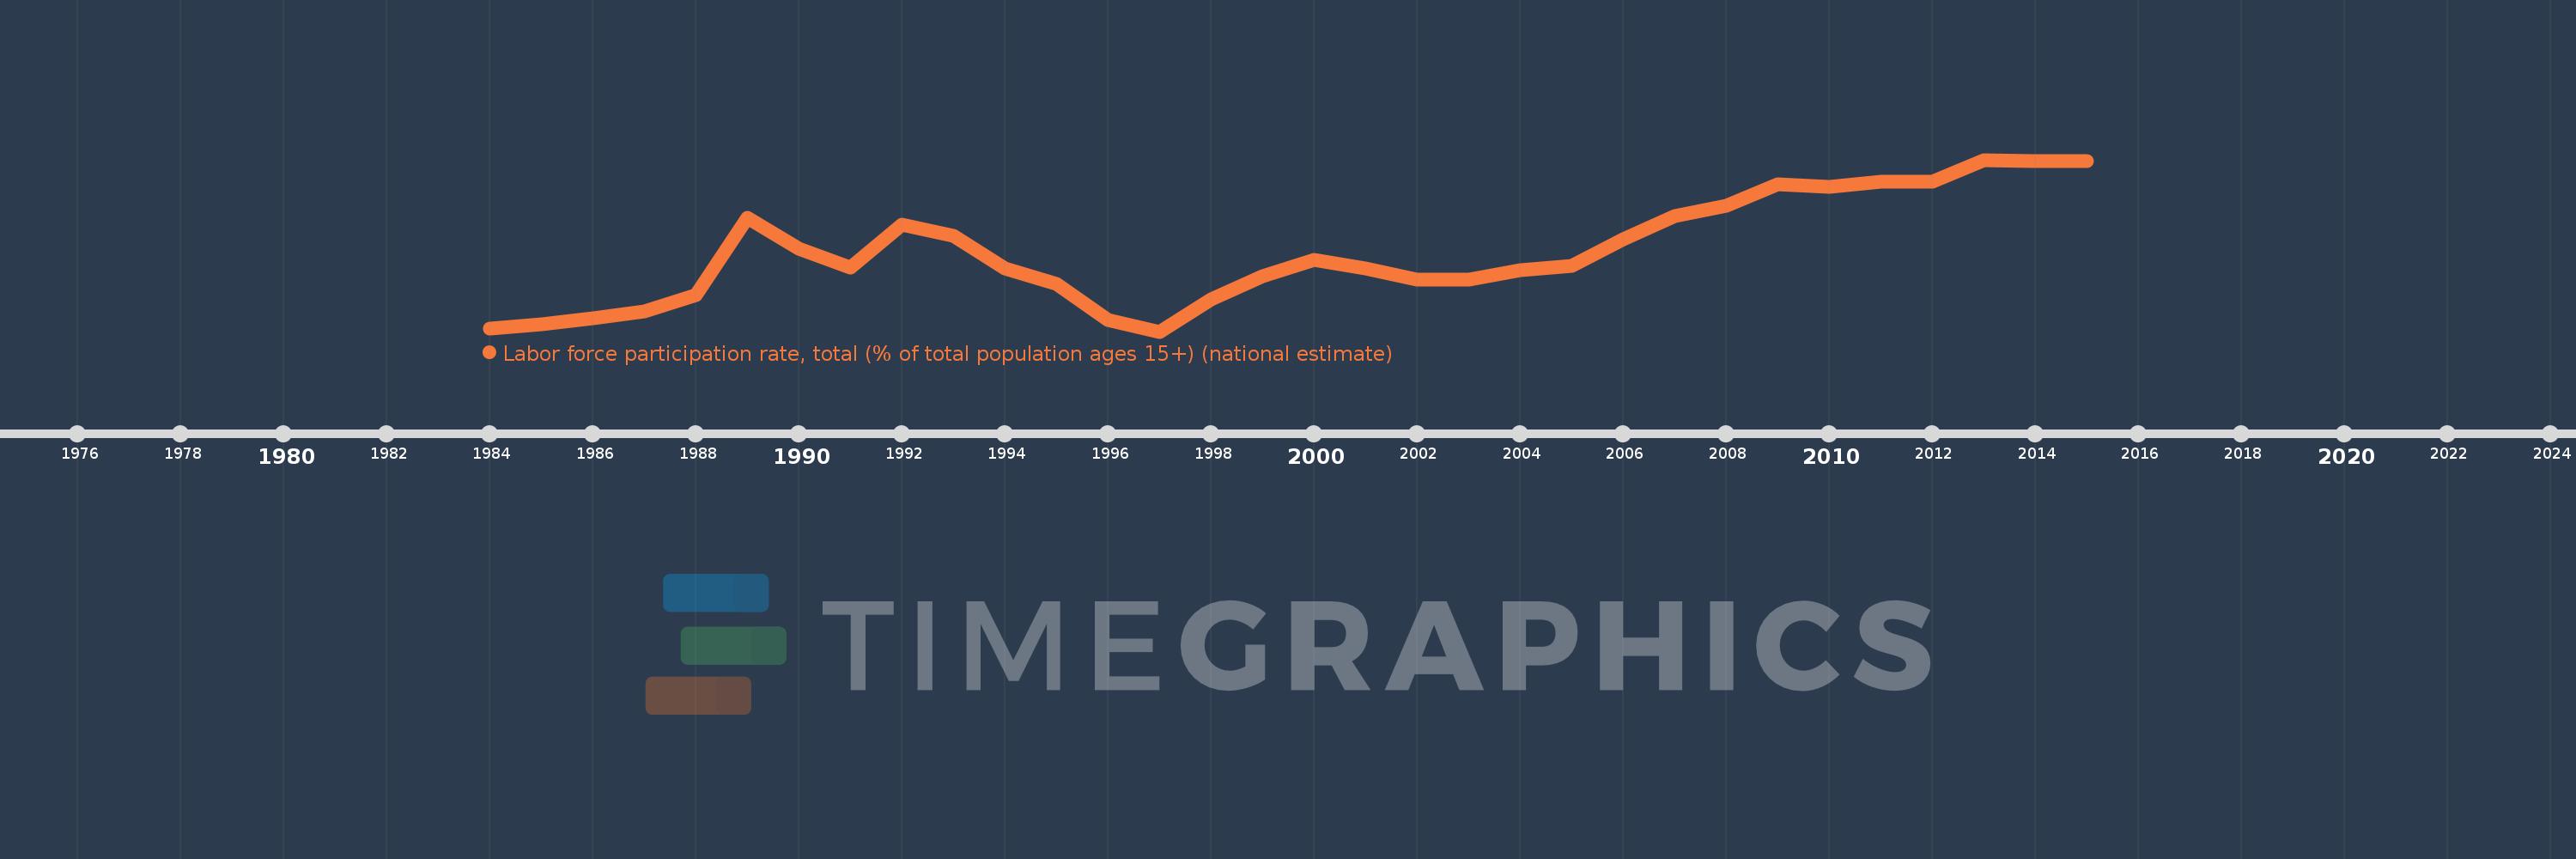
Labor force participation rate, total (% of total population ages 15+) (national estimate)
2015,2014,2013,2012,2011,2010,2009,2008,2007,2006,2005,2004,2003,2002,2001,2000,1999,1998,1997,1996,1995,1994,1993,1992,1991,1990,1989,1988,1987,1986,1985,1984
This statistics in other country:
AfghanistanAlbaniaAlgeriaAmerican SamoaAntigua and BarbudaArab WorldArgentinaArmeniaArubaAustraliaAustriaAzerbaijanBahamas, TheBahrainBangladeshBarbadosBelarusBelgiumBelizeBeninBermudaBhutanBoliviaBosnia and HerzegovinaBotswanaBrazilBritish Virgin IslandsBrunei DarussalamBulgariaBurkina FasoBurundiCabo VerdeCambodiaCameroonCanadaCaribbean small statesCayman IslandsCentral African RepublicCentral Europe and the BalticsChadChileChinaColombiaComorosCongo, Dem. Rep.Congo, Rep.Costa RicaCote d'IvoireCroatiaCubaCyprusCzech RepublicDenmarkDjiboutiDominicaDominican RepublicEarly-demographic dividendEast Asia & PacificEast Asia & Pacific (excluding high income)East Asia & Pacific (IDA & IBRD countries)EcuadorEgypt, Arab Rep.El SalvadorEquatorial GuineaEstoniaEthiopiaEuro areaEurope & Central AsiaEurope & Central Asia (excluding high income)Europe & Central Asia (IDA & IBRD countries)European UnionFaroe IslandsFijiFinlandFranceFrench PolynesiaGabonGambia, TheGeorgiaGermanyGhanaGibraltarGreeceGrenadaGuamGuatemalaGuineaGuyanaHaitiHigh incomeHondurasHong Kong SAR, ChinaHungaryIBRD onlyIcelandIDA & IBRD totalIDA blendIndiaIndonesiaIran, Islamic Rep.IraqIrelandIsle of ManIsraelItalyJamaicaJapanJordanKazakhstanKenyaKiribatiKorea, Rep.KosovoKuwaitKyrgyz RepublicLao PDRLate-demographic dividendLatin America & Caribbean Latin America & Caribbean (excluding high income)Latin America & the Caribbean (IDA & IBRD countries)LatviaLebanonLesothoLiberiaLibyaLiechtensteinLithuaniaLow & middle incomeLower middle incomeLuxembourgMacao SAR, ChinaMacedonia, FYRMadagascarMalawiMalaysiaMaldivesMaliMaltaMarshall IslandsMauritaniaMauritiusMexicoMiddle East & North AfricaMiddle East & North Africa (excluding high income)Middle East & North Africa (IDA & IBRD countries)Middle incomeMoldovaMonacoMongoliaMontenegroMoroccoMozambiqueMyanmarNamibiaNauruNepalNetherlandsNew CaledoniaNew ZealandNicaraguaNigerNigeriaNorth AmericaNorthern Mariana IslandsNorwayOECD membersOmanPacific island small statesPakistanPalauPanamaPapua New GuineaParaguayPeruPhilippinesPolandPortugalPost-demographic dividendPuerto RicoQatarRomaniaRussian FederationRwandaSamoaSan MarinoSao Tome and PrincipeSaudi ArabiaSenegalSerbiaSeychellesSierra LeoneSingaporeSlovak RepublicSloveniaSolomon IslandsSouth AfricaSouth AsiaSouth Asia (IDA & IBRD)South SudanSpainSri LankaSt. Kitts and NevisSt. LuciaSt. Vincent and the GrenadinesSudanSurinameSwazilandSwedenSwitzerlandSyrian Arab RepublicTajikistanTanzaniaThailandTimor-LesteTogoTongaTrinidad and TobagoTunisiaTurkeyTurkmenistanTurks and Caicos IslandsTuvaluUgandaUkraineUnited Arab EmiratesUnited KingdomUnited StatesUpper middle incomeUruguayVanuatuVenezuela, RBVietnamVirgin Islands (U.S.)West Bank and GazaWorldYemen, Rep.ZambiaZimbabwe Timeline:
This timeline shows a graph from 1984 to 2015 of European Union. No data until 1983. Number of actual observations by date: 32.
Source name:
World Development Indicators
Source organization:
International Labour Organization, Key Indicators of the Labour Market database.
Categories, topics:
Social Protection & Labor
Last updated:
apr 23, 2017
Indicators value changes by year
Minimum:
55.735
jan 1, 1997
At the date of observation
Value
Absolute change
Change from previous value
jan 1, 1984
55.773
+55.773
0.0%
jan 1, 1985
55.822
+0.049
0.09%
jan 1, 1986
55.893
+0.071
0.13%
jan 1, 1987
55.979
+0.086
0.15%
jan 1, 1988
56.171
+0.192
0.34%
jan 1, 1989
57.079
+0.909
1.62%
jan 1, 1990
56.715
-0.365
-0.64%
jan 1, 1991
56.497
-0.217
-0.38%
jan 1, 1992
56.998
+0.501
0.89%
jan 1, 1993
56.866
-0.132
-0.23%
jan 1, 1994
56.481
-0.385
-0.68%
jan 1, 1995
56.301
-0.18
-0.32%
jan 1, 1996
55.871
-0.43
-0.76%
jan 1, 1997
55.735
-0.136
-0.24%
jan 1, 1998
56.121
+0.386
0.69%
jan 1, 1999
56.391
+0.269
0.48%
jan 1, 2000
56.587
+0.196
0.35%
jan 1, 2001
56.478
-0.109
-0.19%
jan 1, 2002
56.355
-0.123
-0.22%
jan 1, 2003
56.35
-0.005
-0.01%
jan 1, 2004
56.464
+0.114
0.2%
jan 1, 2005
56.516
+0.052
0.09%
jan 1, 2006
56.831
+0.315
0.56%
jan 1, 2007
57.107
+0.275
0.48%
jan 1, 2008
57.225
+0.118
0.21%
jan 1, 2009
57.478
+0.253
0.44%
jan 1, 2010
57.446
-0.033
-0.06%
jan 1, 2011
57.515
+0.07
0.12%
jan 1, 2012
57.508
-0.007
-0.01%
jan 1, 2013
57.77
+0.262
0.46%
jan 1, 2014
57.756
-0.014
-0.02%
jan 1, 2015
57.752
-0.004
-0.01%
Ranking of countries by current statistics by years


Comments: