29
/
en
AIzaSyAYiBZKx7MnpbEhh9jyipgxe19OcubqV5w
April 1, 2024
287169
Zimbabwe
ZWE
true
2
1
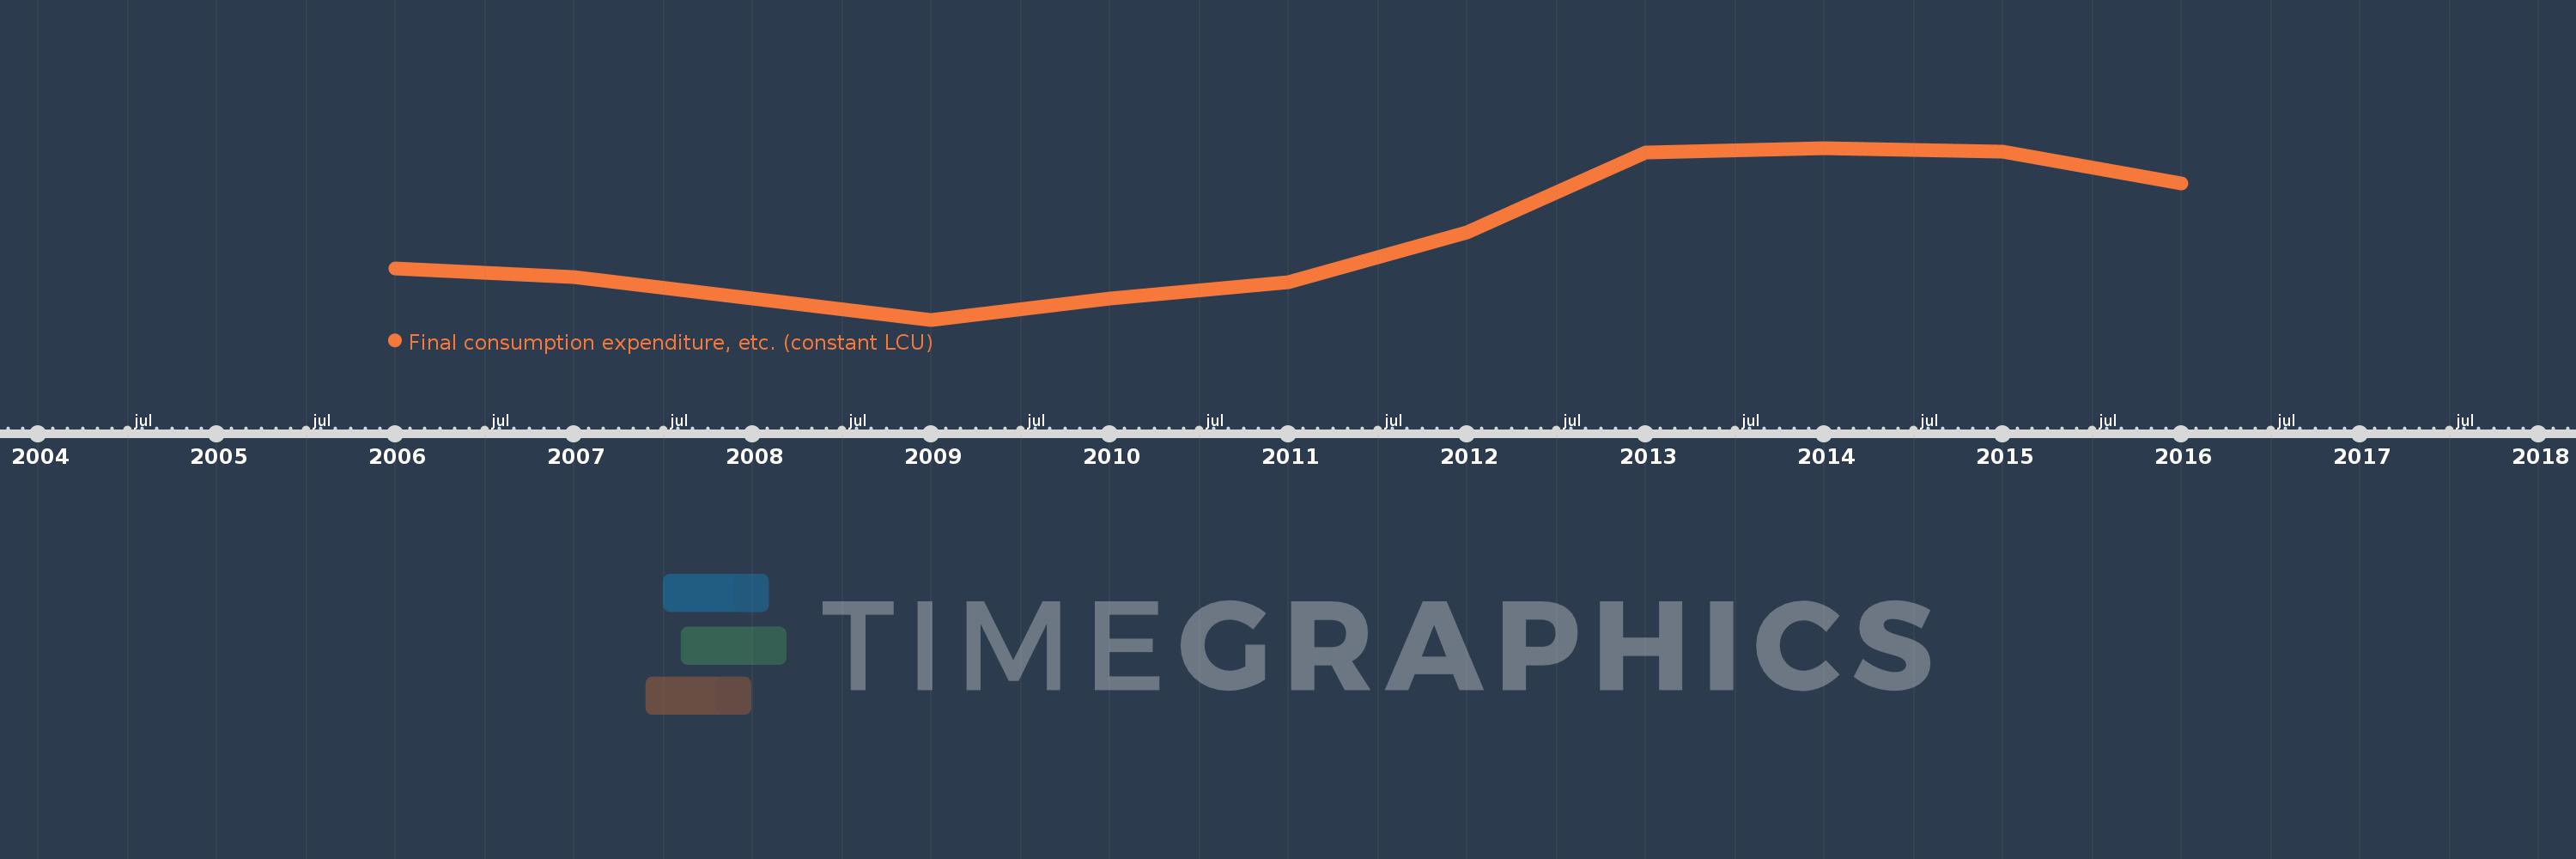
Final consumption expenditure, etc. (constant LCU)
2016,2015,2014,2013,2012,2011,2010,2009,2008,2007,2006
This statistics in other country:
AlbaniaAlgeriaAngolaAntigua and BarbudaArgentinaArmeniaAustraliaAustriaAzerbaijanBahamas, TheBahrainBangladeshBarbadosBelarusBelgiumBelizeBeninBhutanBoliviaBosnia and HerzegovinaBotswanaBrazilBrunei DarussalamBulgariaBurkina FasoBurundiCabo VerdeCambodiaCameroonCanadaChadChileColombiaComorosCongo, Dem. Rep.Congo, Rep.Costa RicaCote d'IvoireCroatiaCubaCyprusCzech RepublicDenmarkDjiboutiDominican RepublicEcuadorEgypt, Arab Rep.El SalvadorEquatorial GuineaEritreaEstoniaEthiopiaFijiFinlandFranceGabonGambia, TheGeorgiaGermanyGhanaGreeceGuatemalaGuineaGuinea-BissauHaitiHondurasHong Kong SAR, ChinaHungaryIcelandIndiaIndonesiaIran, Islamic Rep.IrelandIsraelItalyJamaicaJapanJordanKazakhstanKenyaKorea, Rep.KosovoKuwaitKyrgyz RepublicLao PDRLatviaLebanonLiberiaLithuaniaLuxembourgMacao SAR, ChinaMacedonia, FYRMadagascarMalawiMalaysiaMaliMaltaMauritaniaMauritiusMexicoMoldovaMongoliaMontenegroMoroccoMozambiqueNamibiaNepalNetherlandsNew ZealandNicaraguaNigerNigeriaNorwayOmanPakistanPanamaPapua New GuineaParaguayPeruPhilippinesPolandPortugalPuerto RicoQatarRomaniaRussian FederationRwandaSaudi ArabiaSenegalSerbiaSeychellesSierra LeoneSingaporeSlovak RepublicSloveniaSomaliaSouth AfricaSouth SudanSpainSri LankaSudanSurinameSwazilandSwedenSwitzerlandSyrian Arab RepublicTajikistanTanzaniaThailandTimor-LesteTogoTrinidad and TobagoTunisiaTurkeyTurkmenistanUgandaUkraineUnited Arab EmiratesUnited KingdomUnited StatesUruguayUzbekistanVanuatuVenezuela, RBVietnamWest Bank and GazaZambiaZimbabwe Timeline:
This timeline shows a graph from 2006 to 2016 of Zimbabwe. No data until 2005. Number of actual observations by date: 11.
Source name:
World Development Indicators
Source organization:
World Bank national accounts data, and OECD National Accounts data files.
Categories, topics:
Economy & Growth
Last updated:
apr 23, 2017
Indicators value changes by year
Minimum:
8.221 bln
jan 1, 2009
Maximum:
13.842 bln
jan 1, 2014
At the date of observation
Value
Absolute change
Change from previous value
jan 1, 2006
9.906 bln
+9.906 bln
0.0%
jan 1, 2007
9.631 bln
-274.781 mln
-2.77%
jan 1, 2008
8.928 bln
-703.184 mln
-7.3%
jan 1, 2009
8.221 bln
-706.523 mln
-7.91%
jan 1, 2010
8.92 bln
+698.395 mln
8.5%
jan 1, 2011
9.453 bln
+533.808 mln
5.98%
jan 1, 2012
11.074 bln
+1.621 bln
17.15%
jan 1, 2013
13.694 bln
+2.619 bln
23.65%
jan 1, 2014
13.842 bln
+148.586 mln
1.09%
jan 1, 2015
13.712 bln
-130.28 mln
-0.94%
jan 1, 2016
12.67 bln
-1.042 bln
-7.6%
Ranking of countries by current statistics by years


Comments: