29
/
en
AIzaSyAYiBZKx7MnpbEhh9jyipgxe19OcubqV5w
April 1, 2024
206712
Nepal
NPL
true
2
1
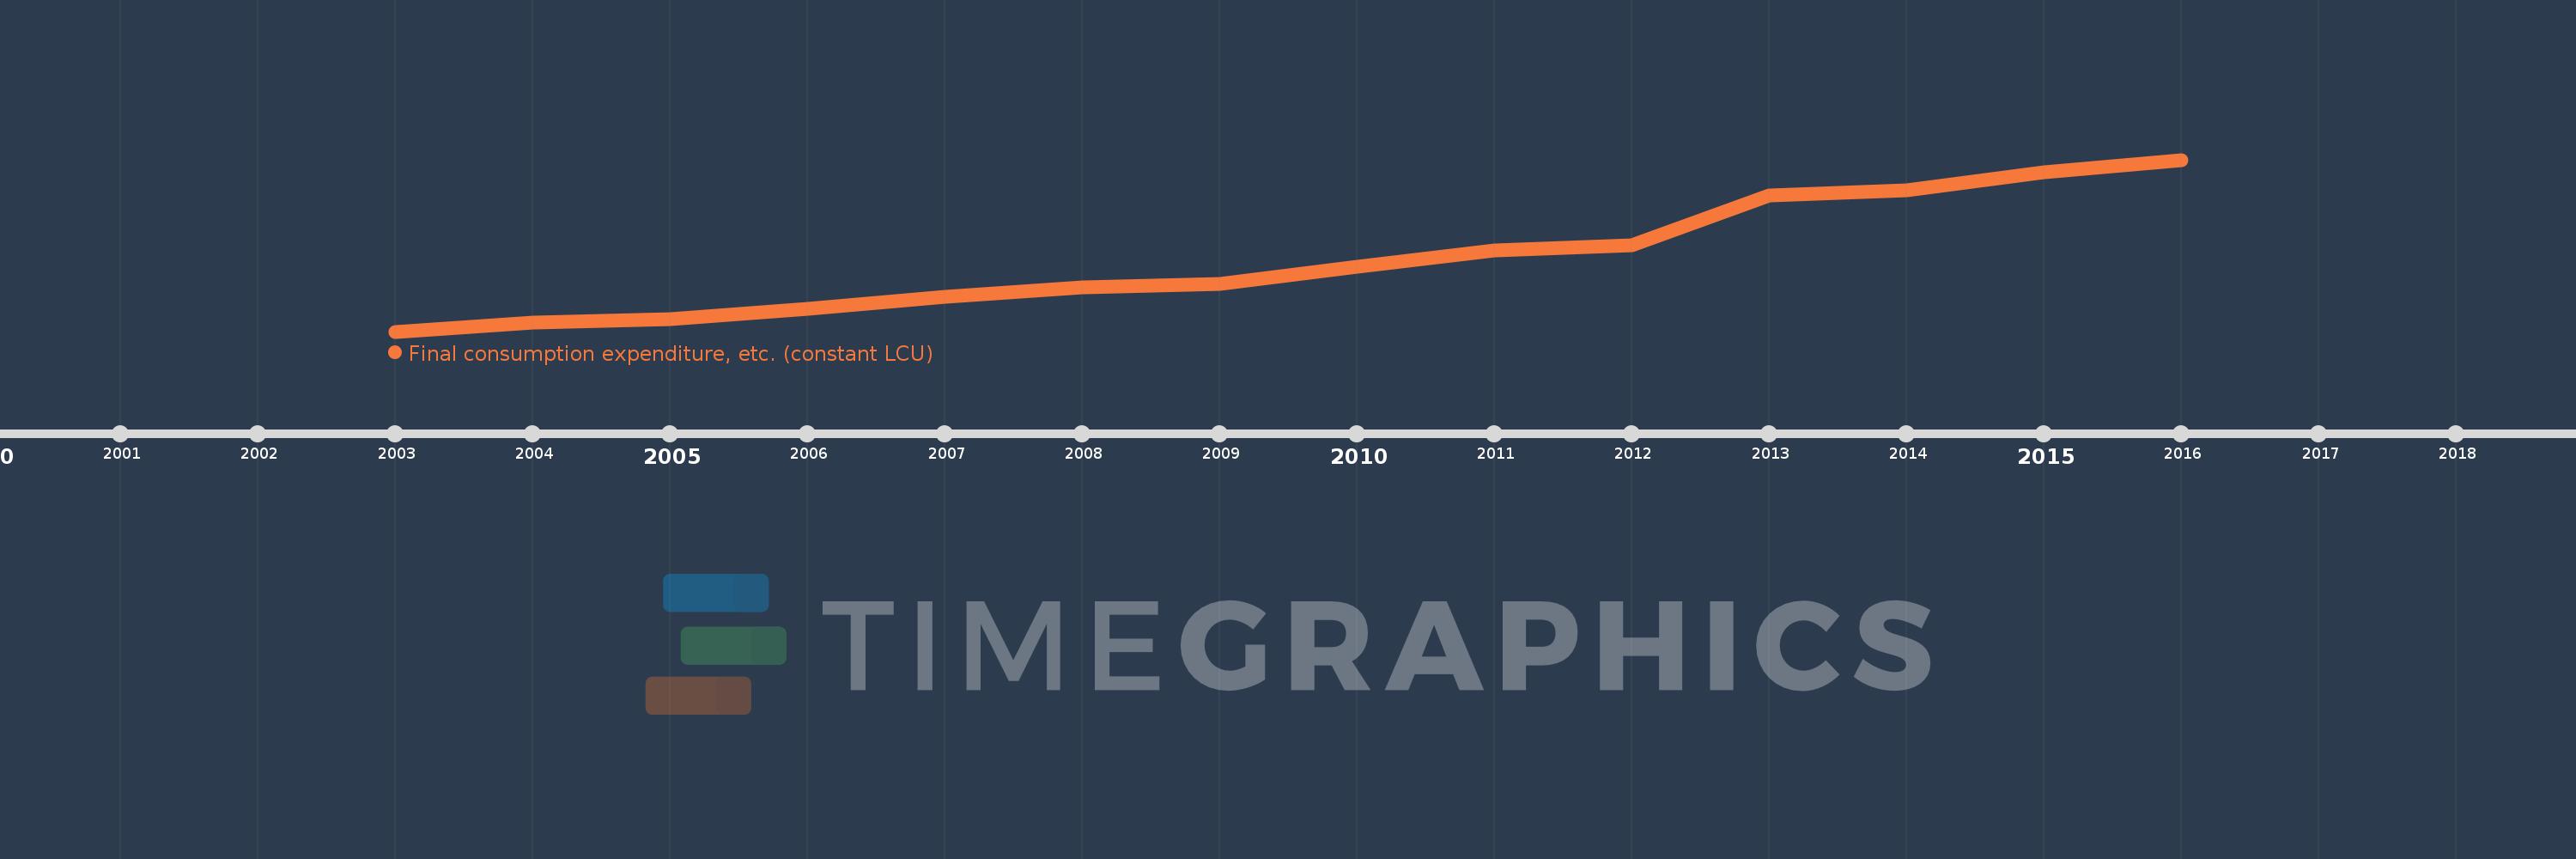
Final consumption expenditure, etc. (constant LCU)
2016,2015,2014,2013,2012,2011,2010,2009,2008,2007,2006,2005,2004,2003
This statistics in other country:
AlbaniaAlgeriaAngolaAntigua and BarbudaArgentinaArmeniaAustraliaAustriaAzerbaijanBahamas, TheBahrainBangladeshBarbadosBelarusBelgiumBelizeBeninBhutanBoliviaBosnia and HerzegovinaBotswanaBrazilBrunei DarussalamBulgariaBurkina FasoBurundiCabo VerdeCambodiaCameroonCanadaChadChileColombiaComorosCongo, Dem. Rep.Congo, Rep.Costa RicaCote d'IvoireCroatiaCubaCyprusCzech RepublicDenmarkDjiboutiDominican RepublicEcuadorEgypt, Arab Rep.El SalvadorEquatorial GuineaEritreaEstoniaEthiopiaFijiFinlandFranceGabonGambia, TheGeorgiaGermanyGhanaGreeceGuatemalaGuineaGuinea-BissauHaitiHondurasHong Kong SAR, ChinaHungaryIcelandIndiaIndonesiaIran, Islamic Rep.IrelandIsraelItalyJamaicaJapanJordanKazakhstanKenyaKorea, Rep.KosovoKuwaitKyrgyz RepublicLao PDRLatviaLebanonLiberiaLithuaniaLuxembourgMacao SAR, ChinaMacedonia, FYRMadagascarMalawiMalaysiaMaliMaltaMauritaniaMauritiusMexicoMoldovaMongoliaMontenegroMoroccoMozambiqueNamibiaNepalNetherlandsNew ZealandNicaraguaNigerNigeriaNorwayOmanPakistanPanamaPapua New GuineaParaguayPeruPhilippinesPolandPortugalPuerto RicoQatarRomaniaRussian FederationRwandaSaudi ArabiaSenegalSerbiaSeychellesSierra LeoneSingaporeSlovak RepublicSloveniaSomaliaSouth AfricaSouth SudanSpainSri LankaSudanSurinameSwazilandSwedenSwitzerlandSyrian Arab RepublicTajikistanTanzaniaThailandTimor-LesteTogoTrinidad and TobagoTunisiaTurkeyTurkmenistanUgandaUkraineUnited Arab EmiratesUnited KingdomUnited StatesUruguayUzbekistanVanuatuVenezuela, RBVietnamWest Bank and GazaZambiaZimbabwe Timeline:
This timeline shows a graph from 2003 to 2016 of Nepal. No data until 2002. Number of actual observations by date: 14.
Source name:
World Development Indicators
Source organization:
World Bank national accounts data, and OECD National Accounts data files.
Categories, topics:
Economy & Growth
Last updated:
apr 23, 2017
Indicators value changes by year
Minimum:
405.389 bln
jan 1, 2003
Maximum:
718.33 bln
jan 1, 2016
At the date of observation
Value
Absolute change
Change from previous value
jan 1, 2003
405.389 bln
+405.389 bln
0.0%
jan 1, 2004
421.043 bln
+15.654 bln
3.86%
jan 1, 2005
428.451 bln
+7.408 bln
1.76%
jan 1, 2006
446.957 bln
+18.506 bln
4.32%
jan 1, 2007
468.922 bln
+21.965 bln
4.91%
jan 1, 2008
485.656 bln
+16.734 bln
3.57%
jan 1, 2009
492.849 bln
+7.193 bln
1.48%
jan 1, 2010
522.909 bln
+30.06 bln
6.1%
jan 1, 2011
552.676 bln
+29.767 bln
5.69%
jan 1, 2012
563.138 bln
+10.462 bln
1.89%
jan 1, 2013
652.645 bln
+89.507 bln
15.89%
jan 1, 2014
663.051 bln
+10.406 bln
1.59%
jan 1, 2015
694.875 bln
+31.823 bln
4.8%
jan 1, 2016
718.33 bln
+23.455 bln
3.38%
Ranking of countries by current statistics by years


Comments: