29
/
en
AIzaSyAYiBZKx7MnpbEhh9jyipgxe19OcubqV5w
April 1, 2024
287138
Zimbabwe
ZWE
true
2
1
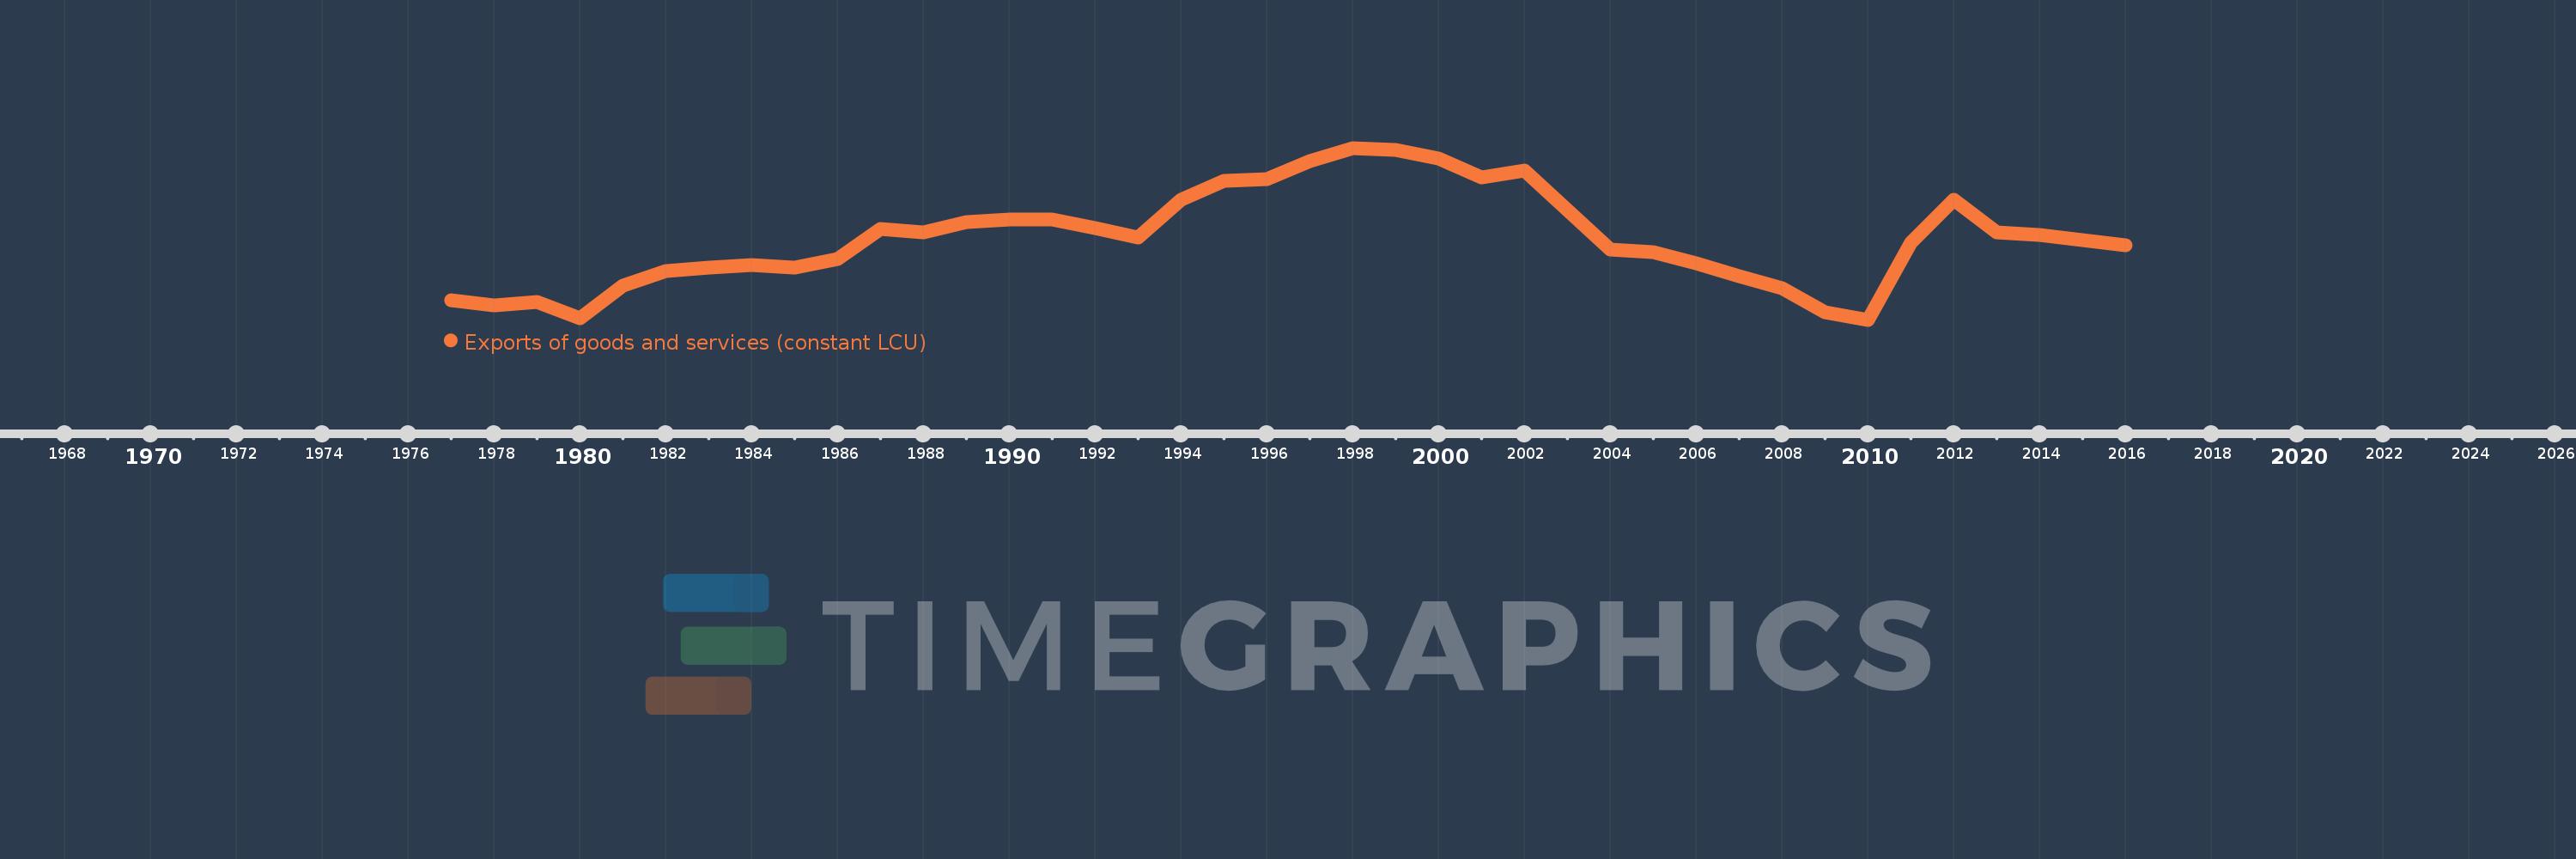
Exports of goods and services (constant LCU)
2016,2015,2014,2013,2012,2011,2010,2009,2008,2007,2006,2005,2004,2003,2002,2001,2000,1999,1998,1997,1996,1995,1994,1993,1992,1991,1990,1989,1988,1987,1986,1985,1984,1983,1982,1981,1980,1979,1978,1977
This statistics in other country:
AlbaniaAlgeriaAngolaAntigua and BarbudaArgentinaArmeniaAustraliaAustriaAzerbaijanBahamas, TheBahrainBangladeshBarbadosBelarusBelgiumBelizeBeninBhutanBoliviaBosnia and HerzegovinaBotswanaBrazilBrunei DarussalamBulgariaBurkina FasoBurundiCabo VerdeCambodiaCameroonCanadaChadChileColombiaComorosCongo, Dem. Rep.Congo, Rep.Costa RicaCote d'IvoireCroatiaCubaCyprusCzech RepublicDenmarkDjiboutiDominican RepublicEcuadorEgypt, Arab Rep.El SalvadorEquatorial GuineaEritreaEstoniaEthiopiaFijiFinlandFranceGabonGambia, TheGeorgiaGermanyGhanaGreeceGuatemalaGuineaGuinea-BissauHaitiHondurasHong Kong SAR, ChinaHungaryIcelandIndiaIndonesiaIran, Islamic Rep.IrelandIsraelItalyJamaicaJapanJordanKazakhstanKenyaKorea, Rep.KosovoKuwaitKyrgyz RepublicLao PDRLatviaLebanonLiberiaLibyaLithuaniaLuxembourgMacao SAR, ChinaMacedonia, FYRMadagascarMalawiMalaysiaMaliMaltaMauritaniaMauritiusMexicoMoldovaMongoliaMontenegroMoroccoMozambiqueMyanmarNamibiaNepalNetherlandsNew ZealandNicaraguaNigerNigeriaNorwayOmanPakistanPanamaPapua New GuineaParaguayPeruPhilippinesPolandPortugalPuerto RicoQatarRomaniaRussian FederationRwandaSamoaSaudi ArabiaSenegalSerbiaSeychellesSierra LeoneSingaporeSlovak RepublicSloveniaSomaliaSouth AfricaSouth SudanSpainSri LankaSudanSurinameSwazilandSwedenSwitzerlandSyrian Arab RepublicTajikistanTanzaniaThailandTimor-LesteTogoTrinidad and TobagoTunisiaTurkeyTurkmenistanUgandaUkraineUnited Arab EmiratesUnited KingdomUnited StatesUruguayUzbekistanVanuatuVenezuela, RBVietnamWest Bank and GazaZambiaZimbabwe Timeline:
This timeline shows a graph from 1977 to 2016 of Zimbabwe. No data until 1976. Number of actual observations by date: 40.
Source name:
World Development Indicators
Source organization:
World Bank national accounts data, and OECD National Accounts data files.
Categories, topics:
Economy & Growth
Last updated:
apr 23, 2017
Indicators value changes by year
Minimum:
1.796 bln
jan 1, 2010
Maximum:
5.524 bln
jan 1, 1998
At the date of observation
Value
Absolute change
Change from previous value
jan 1, 1977
2.217 bln
+2.217 bln
0.0%
jan 1, 1978
2.104 bln
-112.86 mln
-5.09%
jan 1, 1979
2.187 bln
+83.048 mln
3.95%
jan 1, 1980
1.821 bln
-366.274 mln
-16.75%
jan 1, 1981
2.536 bln
+715.277 mln
39.29%
jan 1, 1982
2.854 bln
+317.643 mln
12.53%
jan 1, 1983
2.929 bln
+75.173 mln
2.63%
jan 1, 1984
2.975 bln
+46.431 mln
1.59%
jan 1, 1985
2.918 bln
-56.748 mln
-1.91%
jan 1, 1986
3.121 bln
+202.688 mln
6.94%
jan 1, 1987
3.771 bln
+649.358 mln
20.8%
jan 1, 1988
3.692 bln
-78.778 mln
-2.09%
jan 1, 1989
3.916 bln
+224.409 mln
6.08%
jan 1, 1990
3.964 bln
+48.029 mln
1.23%
jan 1, 1991
3.962 bln
-1.893 mln
-0.05%
jan 1, 1992
3.789 bln
-173.547 mln
-4.38%
jan 1, 1993
3.587 bln
-201.658 mln
-5.32%
jan 1, 1994
4.404 bln
+816.879 mln
22.77%
jan 1, 1995
4.818 bln
+413.53 mln
9.39%
jan 1, 1996
4.841 bln
+23.468 mln
0.49%
jan 1, 1997
5.235 bln
+393.956 mln
8.14%
jan 1, 1998
5.524 bln
+288.849 mln
5.52%
jan 1, 1999
5.486 bln
-37.506 mln
-0.68%
jan 1, 2000
5.285 bln
-200.953 mln
-3.66%
jan 1, 2001
4.877 bln
-408.677 mln
-7.73%
jan 1, 2002
5.036 bln
+159.769 mln
3.28%
jan 1, 2003
4.182 bln
-854.417 mln
-16.96%
jan 1, 2004
3.327 bln
-854.684 mln
-20.44%
jan 1, 2005
3.259 bln
-68.421 mln
-2.06%
jan 1, 2006
3.02 bln
-239.258 mln
-7.34%
jan 1, 2007
2.75 bln
-270.029 mln
-8.94%
jan 1, 2008
2.481 bln
-269.086 mln
-9.79%
jan 1, 2009
1.958 bln
-523.0 mln
-21.08%
jan 1, 2010
1.796 bln
-161.846 mln
-8.27%
jan 1, 2011
3.46 bln
+1.665 bln
92.7%
jan 1, 2012
4.397 bln
+937.042 mln
27.08%
jan 1, 2013
3.685 bln
-712.094 mln
-16.19%
jan 1, 2014
3.636 bln
-49.465 mln
-1.34%
jan 1, 2015
3.524 bln
-111.572 mln
-3.07%
jan 1, 2016
3.417 bln
-106.787 mln
-3.03%
Ranking of countries by current statistics by years


Comments: