29
/
en
AIzaSyAYiBZKx7MnpbEhh9jyipgxe19OcubqV5w
April 1, 2024
127299
Equatorial Guinea
GNQ
true
2
1
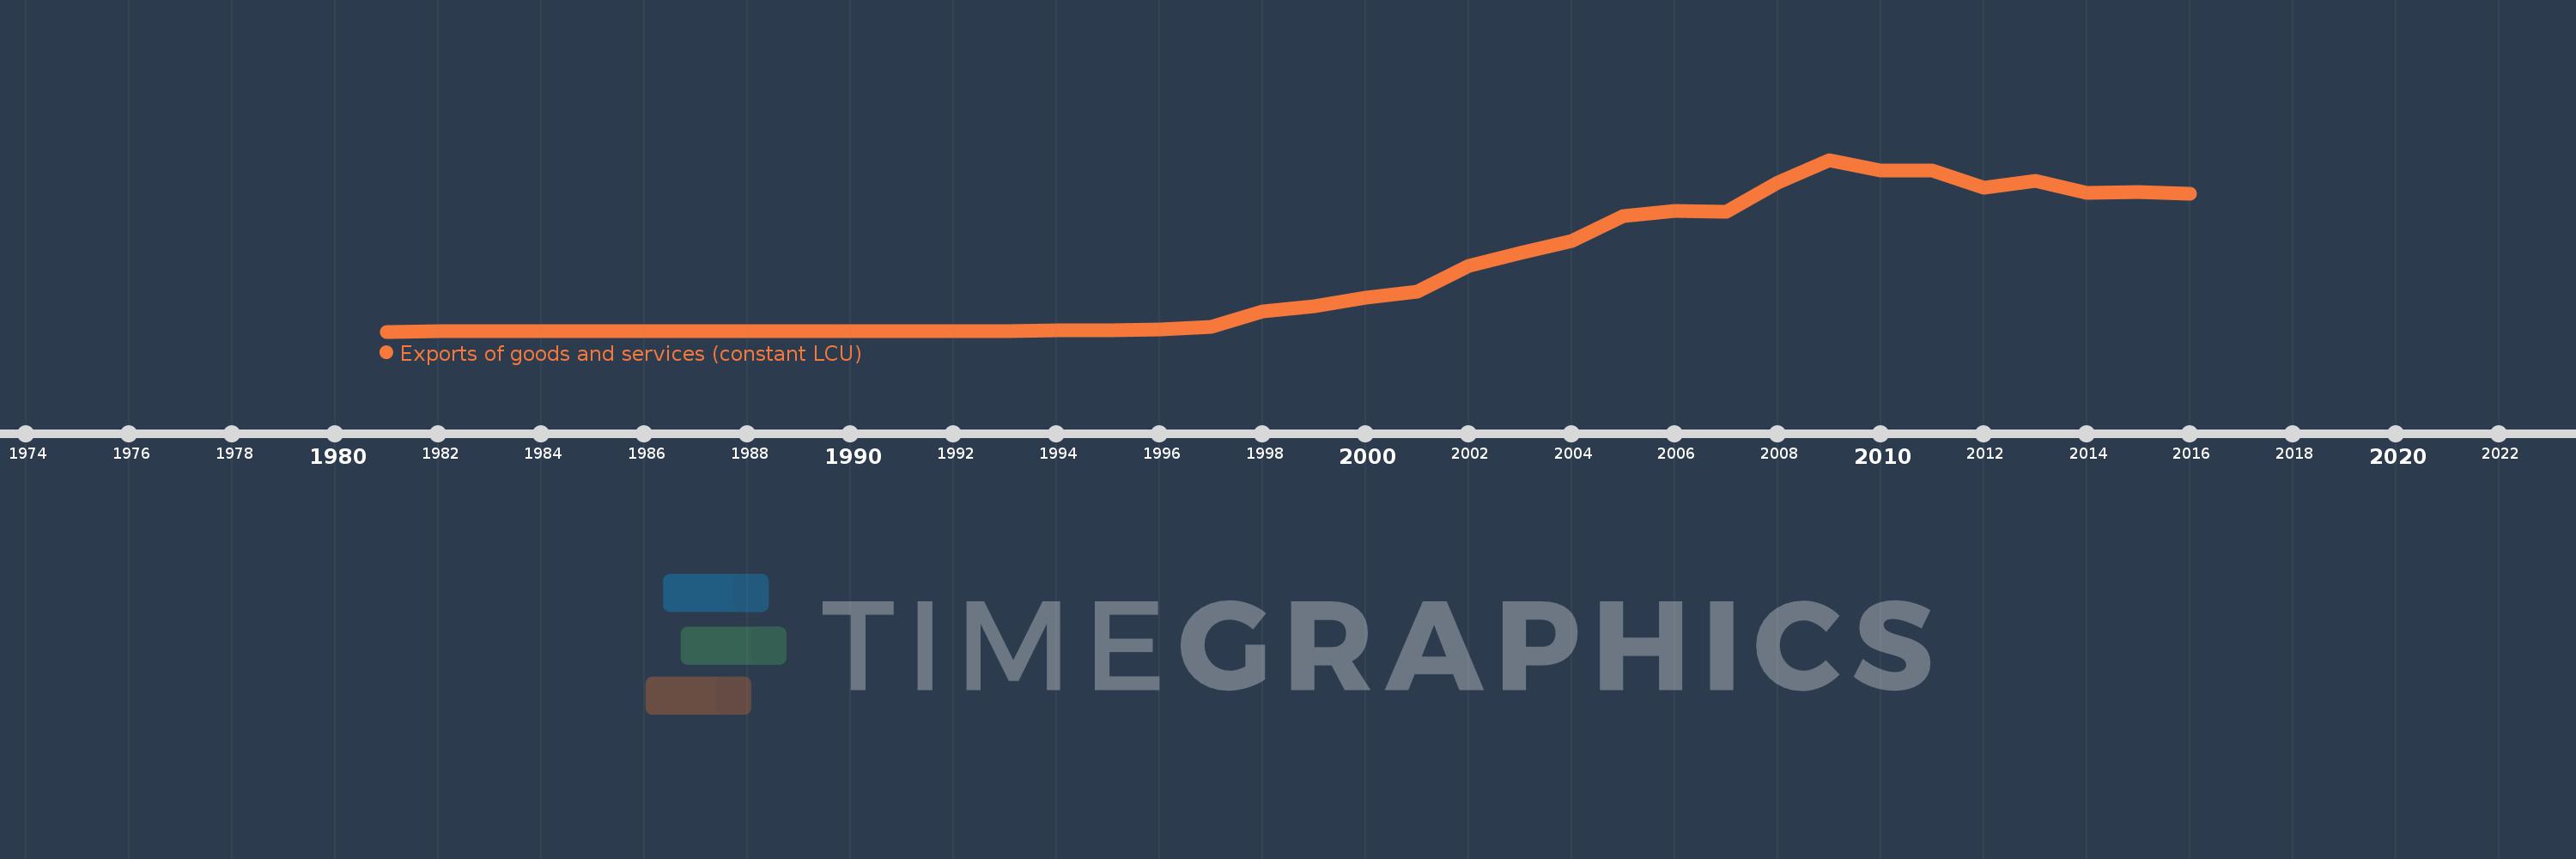
Exports of goods and services (constant LCU)
2016,2015,2014,2013,2012,2011,2010,2009,2008,2007,2006,2005,2004,2003,2002,2001,2000,1999,1998,1997,1996,1995,1994,1993,1992,1991,1990,1989,1988,1987,1986,1985,1984,1983,1982,1981
This statistics in other country:
AlbaniaAlgeriaAngolaAntigua and BarbudaArgentinaArmeniaAustraliaAustriaAzerbaijanBahamas, TheBahrainBangladeshBarbadosBelarusBelgiumBelizeBeninBhutanBoliviaBosnia and HerzegovinaBotswanaBrazilBrunei DarussalamBulgariaBurkina FasoBurundiCabo VerdeCambodiaCameroonCanadaChadChileColombiaComorosCongo, Dem. Rep.Congo, Rep.Costa RicaCote d'IvoireCroatiaCubaCyprusCzech RepublicDenmarkDjiboutiDominican RepublicEcuadorEgypt, Arab Rep.El SalvadorEquatorial GuineaEritreaEstoniaEthiopiaFijiFinlandFranceGabonGambia, TheGeorgiaGermanyGhanaGreeceGuatemalaGuineaGuinea-BissauHaitiHondurasHong Kong SAR, ChinaHungaryIcelandIndiaIndonesiaIran, Islamic Rep.IrelandIsraelItalyJamaicaJapanJordanKazakhstanKenyaKorea, Rep.KosovoKuwaitKyrgyz RepublicLao PDRLatviaLebanonLiberiaLibyaLithuaniaLuxembourgMacao SAR, ChinaMacedonia, FYRMadagascarMalawiMalaysiaMaliMaltaMauritaniaMauritiusMexicoMoldovaMongoliaMontenegroMoroccoMozambiqueMyanmarNamibiaNepalNetherlandsNew ZealandNicaraguaNigerNigeriaNorwayOmanPakistanPanamaPapua New GuineaParaguayPeruPhilippinesPolandPortugalPuerto RicoQatarRomaniaRussian FederationRwandaSamoaSaudi ArabiaSenegalSerbiaSeychellesSierra LeoneSingaporeSlovak RepublicSloveniaSomaliaSouth AfricaSouth SudanSpainSri LankaSudanSurinameSwazilandSwedenSwitzerlandSyrian Arab RepublicTajikistanTanzaniaThailandTimor-LesteTogoTrinidad and TobagoTunisiaTurkeyTurkmenistanUgandaUkraineUnited Arab EmiratesUnited KingdomUnited StatesUruguayUzbekistanVanuatuVenezuela, RBVietnamWest Bank and GazaZambiaZimbabwe Timeline:
This timeline shows a graph from 1981 to 2016 of Equatorial Guinea. No data until 1980. Number of actual observations by date: 36.
Source name:
World Development Indicators
Source organization:
World Bank national accounts data, and OECD National Accounts data files.
Categories, topics:
Economy & Growth
Last updated:
apr 23, 2017
Indicators value changes by year
Minimum:
29.648 bln
jan 1, 1981
Maximum:
6.209 trl
jan 1, 2009
At the date of observation
Value
Absolute change
Change from previous value
jan 1, 1981
29.648 bln
+29.648 bln
0.0%
jan 1, 1982
40.856 bln
+11.207 bln
37.8%
jan 1, 1983
32.072 bln
-8.783 bln
-21.5%
jan 1, 1984
36.816 bln
+4.743 bln
14.79%
jan 1, 1985
35.758 bln
-1.058 bln
-2.87%
jan 1, 1986
30.175 bln
-5.583 bln
-15.61%
jan 1, 1987
35.066 bln
+4.891 bln
16.21%
jan 1, 1988
36.991 bln
+1.925 bln
5.49%
jan 1, 1989
40.833 bln
+3.842 bln
10.39%
jan 1, 1990
37.089 bln
-3.743 bln
-9.17%
jan 1, 1991
30.015 bln
-7.075 bln
-19.07%
jan 1, 1992
30.648 bln
+633.634 mln
2.11%
jan 1, 1993
45.414 bln
+14.766 bln
48.18%
jan 1, 1994
60.632 bln
+15.218 bln
33.51%
jan 1, 1995
89.069 bln
+28.437 bln
46.9%
jan 1, 1996
107.073 bln
+18.005 bln
20.21%
jan 1, 1997
208.4 bln
+101.327 bln
94.63%
jan 1, 1998
759.32 bln
+550.92 bln
264.36%
jan 1, 1999
933.756 bln
+174.435 bln
22.97%
jan 1, 2000
1.251 trl
+317.513 bln
34.0%
jan 1, 2001
1.46 trl
+209.01 bln
16.7%
jan 1, 2002
2.408 trl
+948.034 bln
64.92%
jan 1, 2003
2.855 trl
+447.048 bln
18.56%
jan 1, 2004
3.3 trl
+444.151 bln
15.55%
jan 1, 2005
4.18 trl
+880.982 bln
26.7%
jan 1, 2006
4.373 trl
+192.315 bln
4.6%
jan 1, 2007
4.342 trl
-30.835 bln
-0.71%
jan 1, 2008
5.382 trl
+1.04 trl
23.94%
jan 1, 2009
6.209 trl
+827.801 bln
15.38%
jan 1, 2010
5.829 trl
-379.86 bln
-6.12%
jan 1, 2011
5.82 trl
-9.268 bln
-0.16%
jan 1, 2012
5.197 trl
-623.051 bln
-10.7%
jan 1, 2013
5.438 trl
+240.569 bln
4.63%
jan 1, 2014
5.025 trl
-412.353 bln
-7.58%
jan 1, 2015
5.05 trl
+24.323 bln
0.48%
jan 1, 2016
4.997 trl
-52.618 bln
-1.04%
Ranking of countries by current statistics by years


Comments: