30
/
AIzaSyAYiBZKx7MnpbEhh9jyipgxe19OcubqV5w
April 1, 2024
286388
Zambia
ZMB
true
2
1
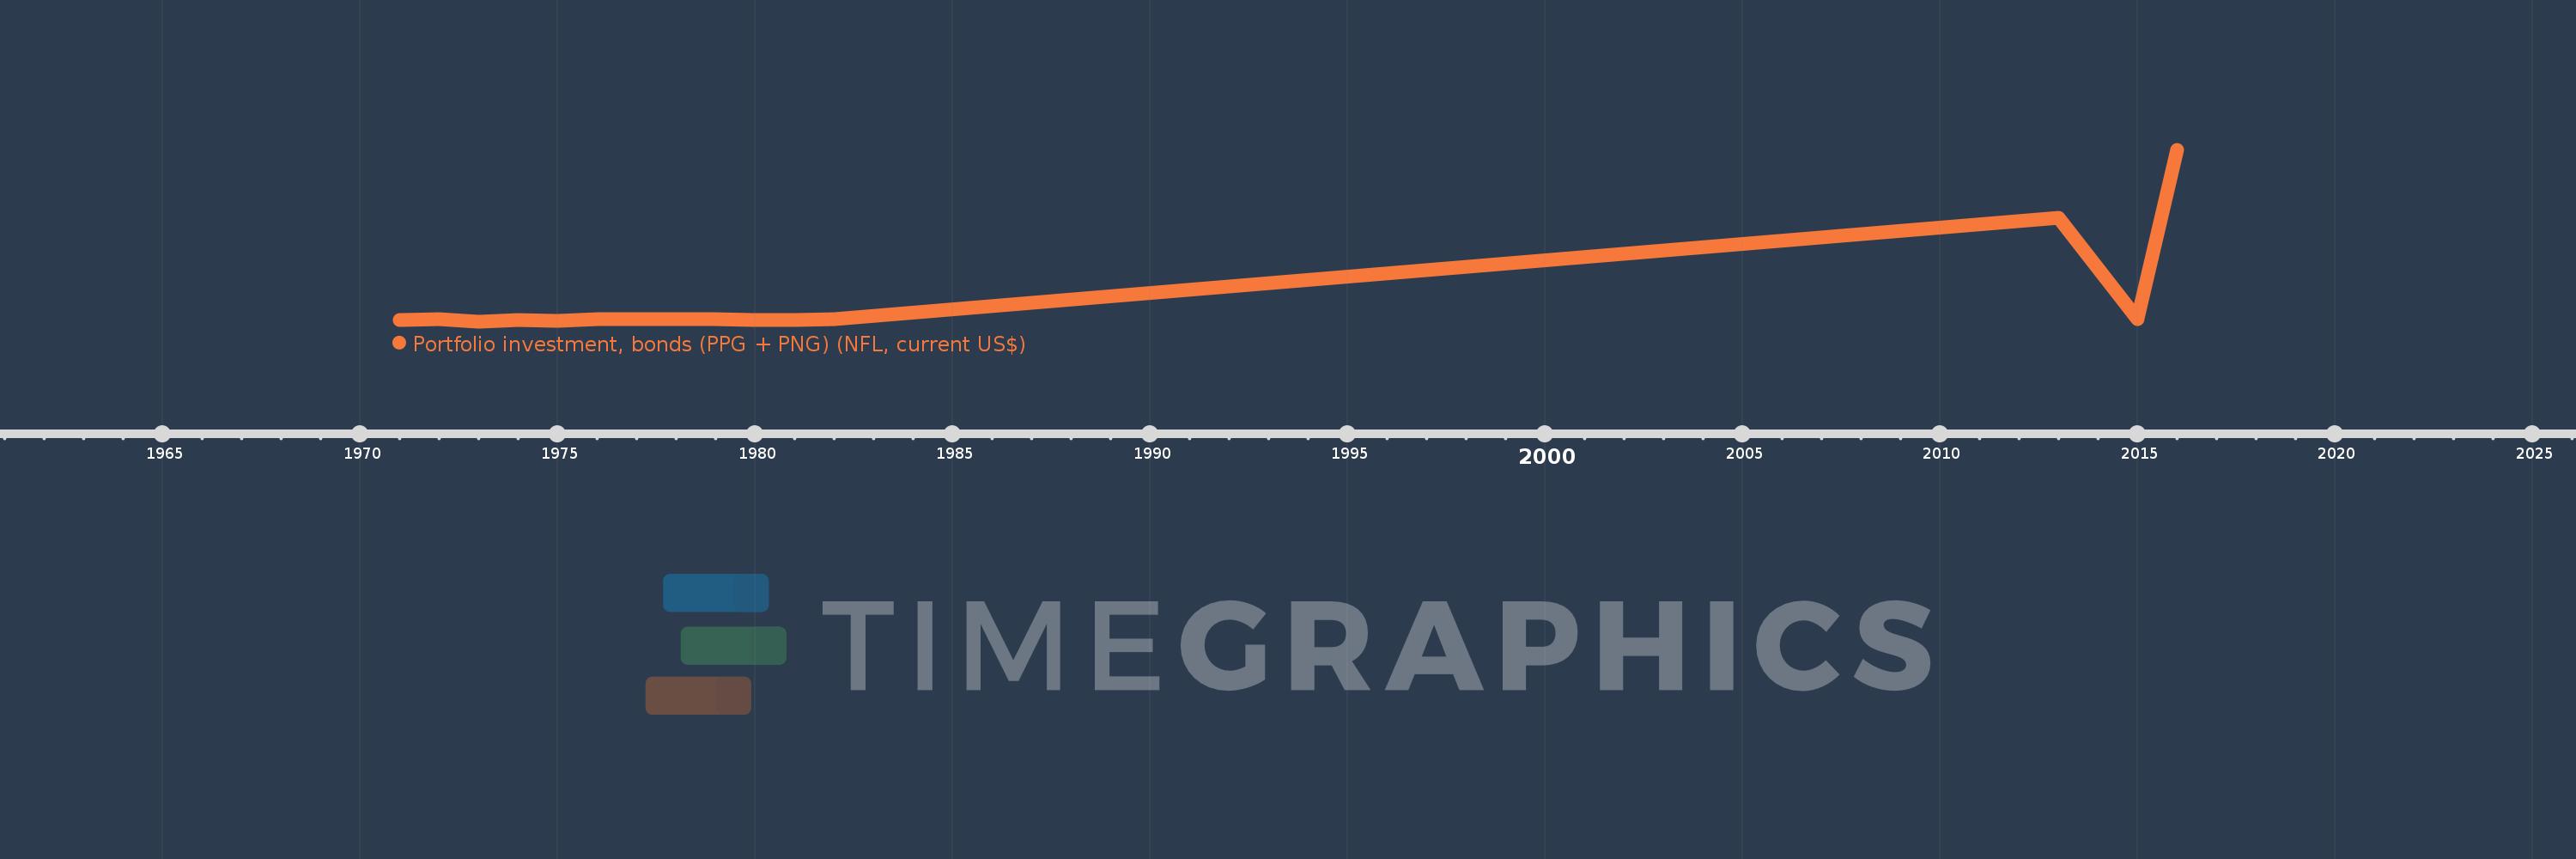
Portfolio investment, bonds (PPG + PNG) (NFL, current US$)
2016,2015,2013,1982,1981,1980,1979,1978,1976,1975,1974,1973,1972,1971
Public Timelines
FAQ
Menu
Public Timelines
FAQ
For education
For educational institutions
For teachers
For students
Open cabinet
Create
Close
Create a timeline
Public timelines
Library
FAQ
Download
Global statistics library
→
Zambia
→
Portfolio investment, bonds (PPG + PNG) (NFL, current US$)
This statistics in other country:
Albania
Algeria
Angola
Argentina
Armenia
Azerbaijan
Belarus
Belize
Benin
Bolivia
Bosnia and Herzegovina
Botswana
Brazil
Bulgaria
Burkina Faso
Cameroon
China
Colombia
Congo, Dem. Rep.
Congo, Rep.
Costa Rica
Cote d'Ivoire
Dominica
Dominican Republic
East Asia & Pacific (excluding high income)
Ecuador
Egypt, Arab Rep.
El Salvador
Ethiopia
Europe & Central Asia (excluding high income)
Fiji
Gabon
Georgia
Ghana
Grenada
Guatemala
Guinea
Guyana
Honduras
India
Indonesia
Jamaica
Jordan
Kazakhstan
Kenya
Lao PDR
Latin America & Caribbean (excluding high income)
Lebanon
Low & middle income
Lower middle income
Macedonia, FYR
Malawi
Malaysia
Mauritania
Mauritius
Mexico
Middle East & North Africa (excluding high income)
Middle income
Moldova
Mongolia
Montenegro
Morocco
Mozambique
Nicaragua
Niger
Nigeria
Pakistan
Panama
Papua New Guinea
Paraguay
Peru
Philippines
Romania
Russian Federation
Rwanda
Samoa
Senegal
Serbia
Sierra Leone
South Africa
South Asia
Sri Lanka
St. Kitts and Nevis
St. Lucia
St. Vincent and the Grenadines
Sub-Saharan Africa (excluding high income)
Sudan
Thailand
Togo
Tunisia
Turkey
Uganda
Ukraine
Upper middle income
Venezuela, RB
Vietnam
Zambia
Zimbabwe
Timeline:
This timeline shows a graph from
1971
to
2016
of Zambia. No data until
1970
. Number of actual observations by date:
14
.
Source name:
World Development Indicators
Source organization:
World Bank, International Debt Statistics.
Categories, topics:
Financial Sector, External Debt
Last updated:
apr 23, 2017
Indicators value changes by year
Meaning:
139.171 mln
Minimum:
-20.26 mln
jan 1, 1973
Maximum:
1.25 bln
jan 1, 2016
At the date of observation
Value
Absolute change
Change from the previous value
jan 1, 1971
-7.052 mln
-7.052 mln
0.0%
jan 1, 1972
-205.0K
+6.847 mln
-97.09%
jan 1, 1973
-20.26 mln
-20.055 mln
9.78K%
jan 1, 1974
-3.434 mln
+16.826 mln
-83.05%
jan 1, 1975
-12.037 mln
-8.603 mln
250.52%
jan 1, 1976
-1.141 mln
+10.896 mln
-90.52%
jan 1, 1978
1.727 mln
+2.868 mln
-251.36%
jan 1, 1979
-426.0K
-2.153 mln
-124.67%
jan 1, 1980
-3.33 mln
-2.904 mln
681.69%
jan 1, 1981
-3.2 mln
+130.0K
-3.9%
jan 1, 1982
-2.255 mln
+945.0K
-29.53%
jan 1, 2013
750.0 mln
+752.255 mln
-33.36K%
jan 1, 2015
0.0
-750.0 mln
-100.0%
jan 1, 2016
1.25 bln
+1.25 bln
%
Ranking of countries by current statistics by years
About & Feedback
Terms
Privacy
Library
2024
©
Time.Graphics
Support 24/7
Cabinet
Get premium
Donate
The service accepts bank transfer (ACH, Wire) or cards (Visa, MasterCard, etc). Processed by Stripe.
Secured with SSL
Excellent (Trustpilot Reviews)
Based on 115+ reviews
Write your own review on
Trustpilot.com
