29
/
en
AIzaSyAYiBZKx7MnpbEhh9jyipgxe19OcubqV5w
April 1, 2024
253484
Sudan
SDN
true
2
1
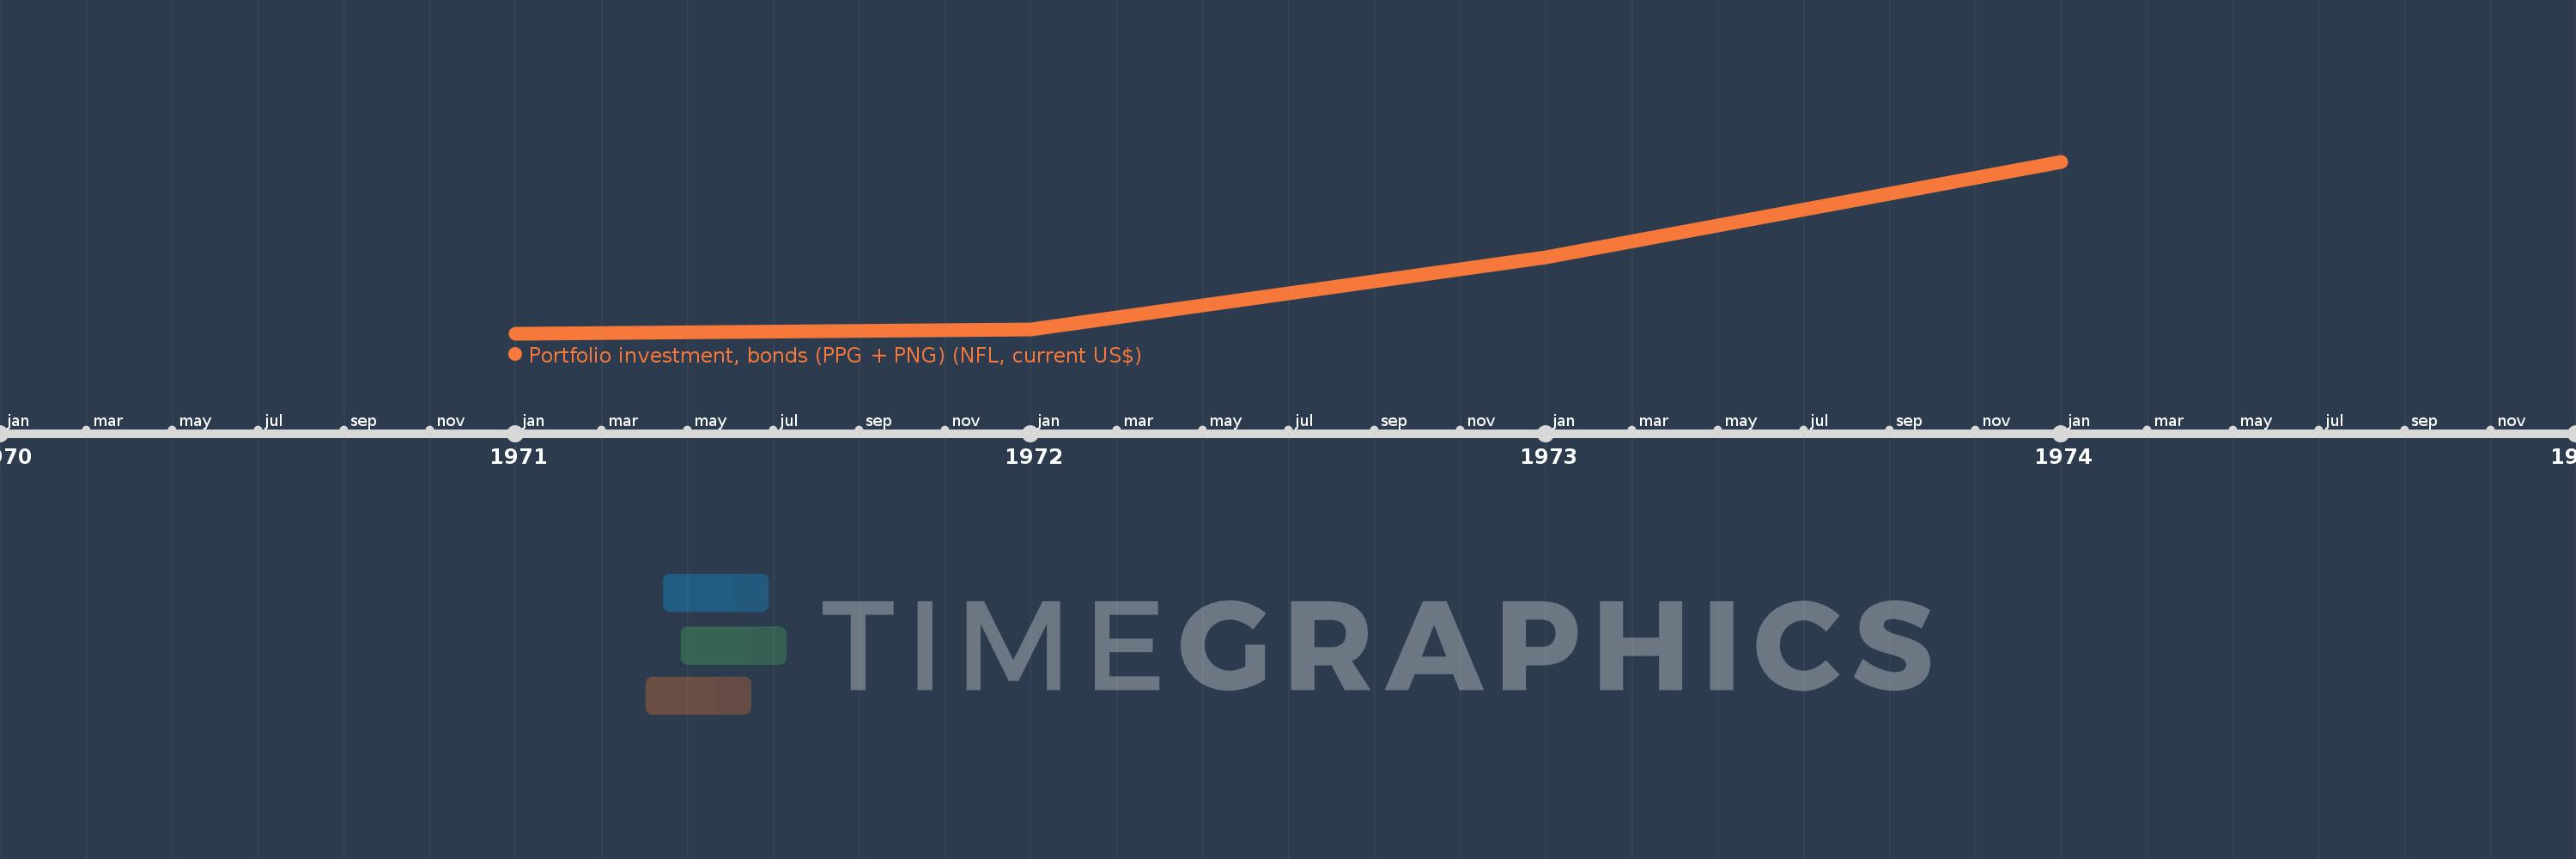
Portfolio investment, bonds (PPG + PNG) (NFL, current US$)
1974,1973,1972,1971
This statistics in other country:
Timeline:
This timeline shows a graph from 1971 to 1974 of Sudan. No data until 1970. Number of actual observations by date: 4.
Source name:
World Development Indicators
Source organization:
World Bank, International Debt Statistics.
Categories, topics:
Financial Sector, External Debt
Last updated:
apr 23, 2017
Indicators value changes by year
Minimum:
-751.0K
jan 1, 1971
Maximum:
-142.0K
jan 1, 1974
At the date of observation
Value
Absolute change
Change from previous value
jan 1, 1971
-751.0K
-751.0K
0.0%
jan 1, 1972
-736.0K
+15.0K
-2.0%
jan 1, 1973
-483.0K
+253.0K
-34.38%
jan 1, 1974
-142.0K
+341.0K
-70.6%
Ranking of countries by current statistics by years


Comments: