30
/
AIzaSyAYiBZKx7MnpbEhh9jyipgxe19OcubqV5w
April 1, 2024
285737
Zambia
ZMB
true
2
1
Demand for family planning satisfied by modern methods (% of married women with demand for family planning)
2015,2008,2003,1997,1993
Download
Global statistics library →Zambia →

Demand for family planning satisfied by modern methods (% of married women with demand for family planning)

This statistics in other country:

AlbaniaAlgeriaArab WorldArmeniaAzerbaijanBangladeshBarbadosBelarusBelgiumBelizeBeninBhutanBoliviaBosnia and HerzegovinaBotswanaBrazilBulgariaBurkina FasoBurundiCabo VerdeCambodiaCameroonCaribbean small statesCentral African RepublicChadChinaColombiaComorosCongo, Dem. Rep.Congo, Rep.Costa RicaCote d'IvoireCubaCzech RepublicDominican RepublicEarly-demographic dividendEast Asia & PacificEast Asia & Pacific (excluding high income)East Asia & Pacific (IDA & IBRD countries)EcuadorEgypt, Arab Rep.El SalvadorEquatorial GuineaEritreaEthiopiaEurope & Central Asia (excluding high income)Europe & Central Asia (IDA & IBRD countries)Fragile and conflict affected situationsFranceGabonGambia, TheGeorgiaGhanaGuatemalaGuineaGuinea-BissauGuyanaHaitiHeavily indebted poor countries (HIPC)HondurasHungaryIBRD onlyIDA & IBRD totalIDA blendIDA onlyIDA totalIndiaIndonesiaIran, Islamic Rep.IraqItalyJamaicaJordanKazakhstanKenyaKiribatiKorea, Dem. People’s Rep.Kyrgyz RepublicLao PDRLate-demographic dividendLatviaLeast developed countries: UN classificationLesothoLiberiaLibyaLithuaniaLow & middle incomeLow incomeLower middle incomeMacedonia, FYRMadagascarMalawiMaldivesMaliMarshall IslandsMauritaniaMauritiusMexicoMiddle East & North AfricaMiddle East & North Africa (excluding high income)Middle East & North Africa (IDA & IBRD countries)Middle incomeMoldovaMongoliaMontenegroMoroccoMozambiqueMyanmarNamibiaNauruNepalNicaraguaNigerNigeriaNorth AmericaOmanOther small statesPakistanPanamaPapua New GuineaParaguayPeruPhilippinesPre-demographic dividendPuerto RicoQatarRomaniaRussian FederationRwandaSamoaSao Tome and PrincipeSenegalSerbiaSierra LeoneSloveniaSolomon IslandsSouth AfricaSouth AsiaSouth Asia (IDA & IBRD)South SudanSpainSri LankaSt. LuciaSub-Saharan Africa Sub-Saharan Africa (excluding high income)Sub-Saharan Africa (IDA & IBRD countries)SudanSurinameSwazilandSyrian Arab RepublicTajikistanTanzaniaThailandTimor-LesteTogoTongaTrinidad and TobagoTunisiaTurkeyTurkmenistanTuvaluUgandaUkraineUnited StatesUpper middle incomeUzbekistanVanuatuVenezuela, RBVietnamWest Bank and GazaYemen, Rep.ZambiaZimbabwe

Timeline:

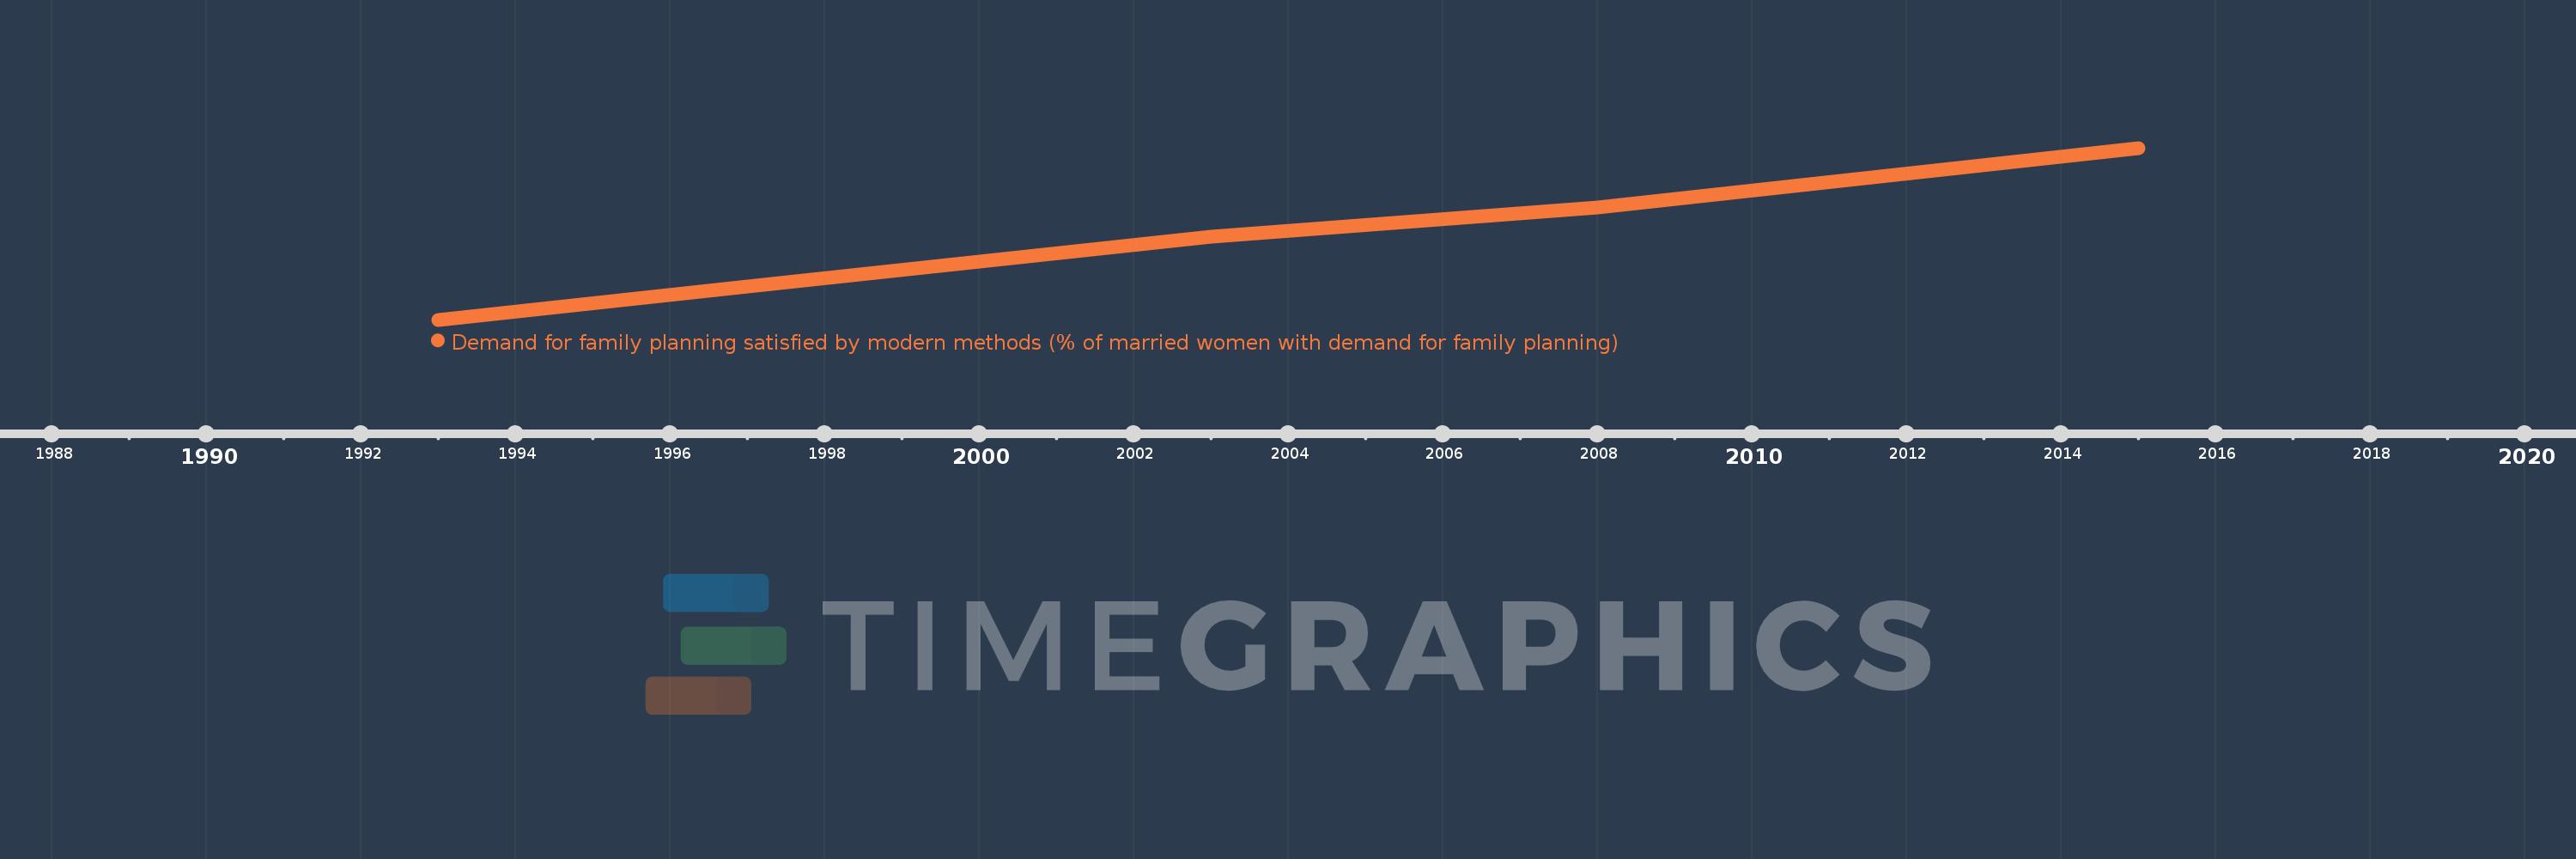
This timeline shows a graph from 1993 to 2015 of Zambia. No data until 1992. Number of actual observations by date: 5.

Source name:

World Development Indicators

Source organization:

Demographic and Health Surveys (DHS).

Categories, topics:

Health

Last updated:

apr 23, 2017

Indicators value changes by year

Meaning:
40.2
Minimum:
19.6
jan 1, 1993
Maximum:
63.8
jan 1, 2015
At the date of observation
Value
Absolute change
Change from the previous value
jan 1, 1993
19.6
+19.6
0.0%
jan 1, 1997
28.1
+8.5
43.37%
jan 1, 2003
41.0
+12.9
45.91%
jan 1, 2008
48.5
+7.5
18.29%
jan 1, 2015
63.8
+15.3
31.55%

Ranking of countries by current statistics by years