29
/
en
AIzaSyAYiBZKx7MnpbEhh9jyipgxe19OcubqV5w
April 1, 2024
210218
Nicaragua
NIC
true
2
1
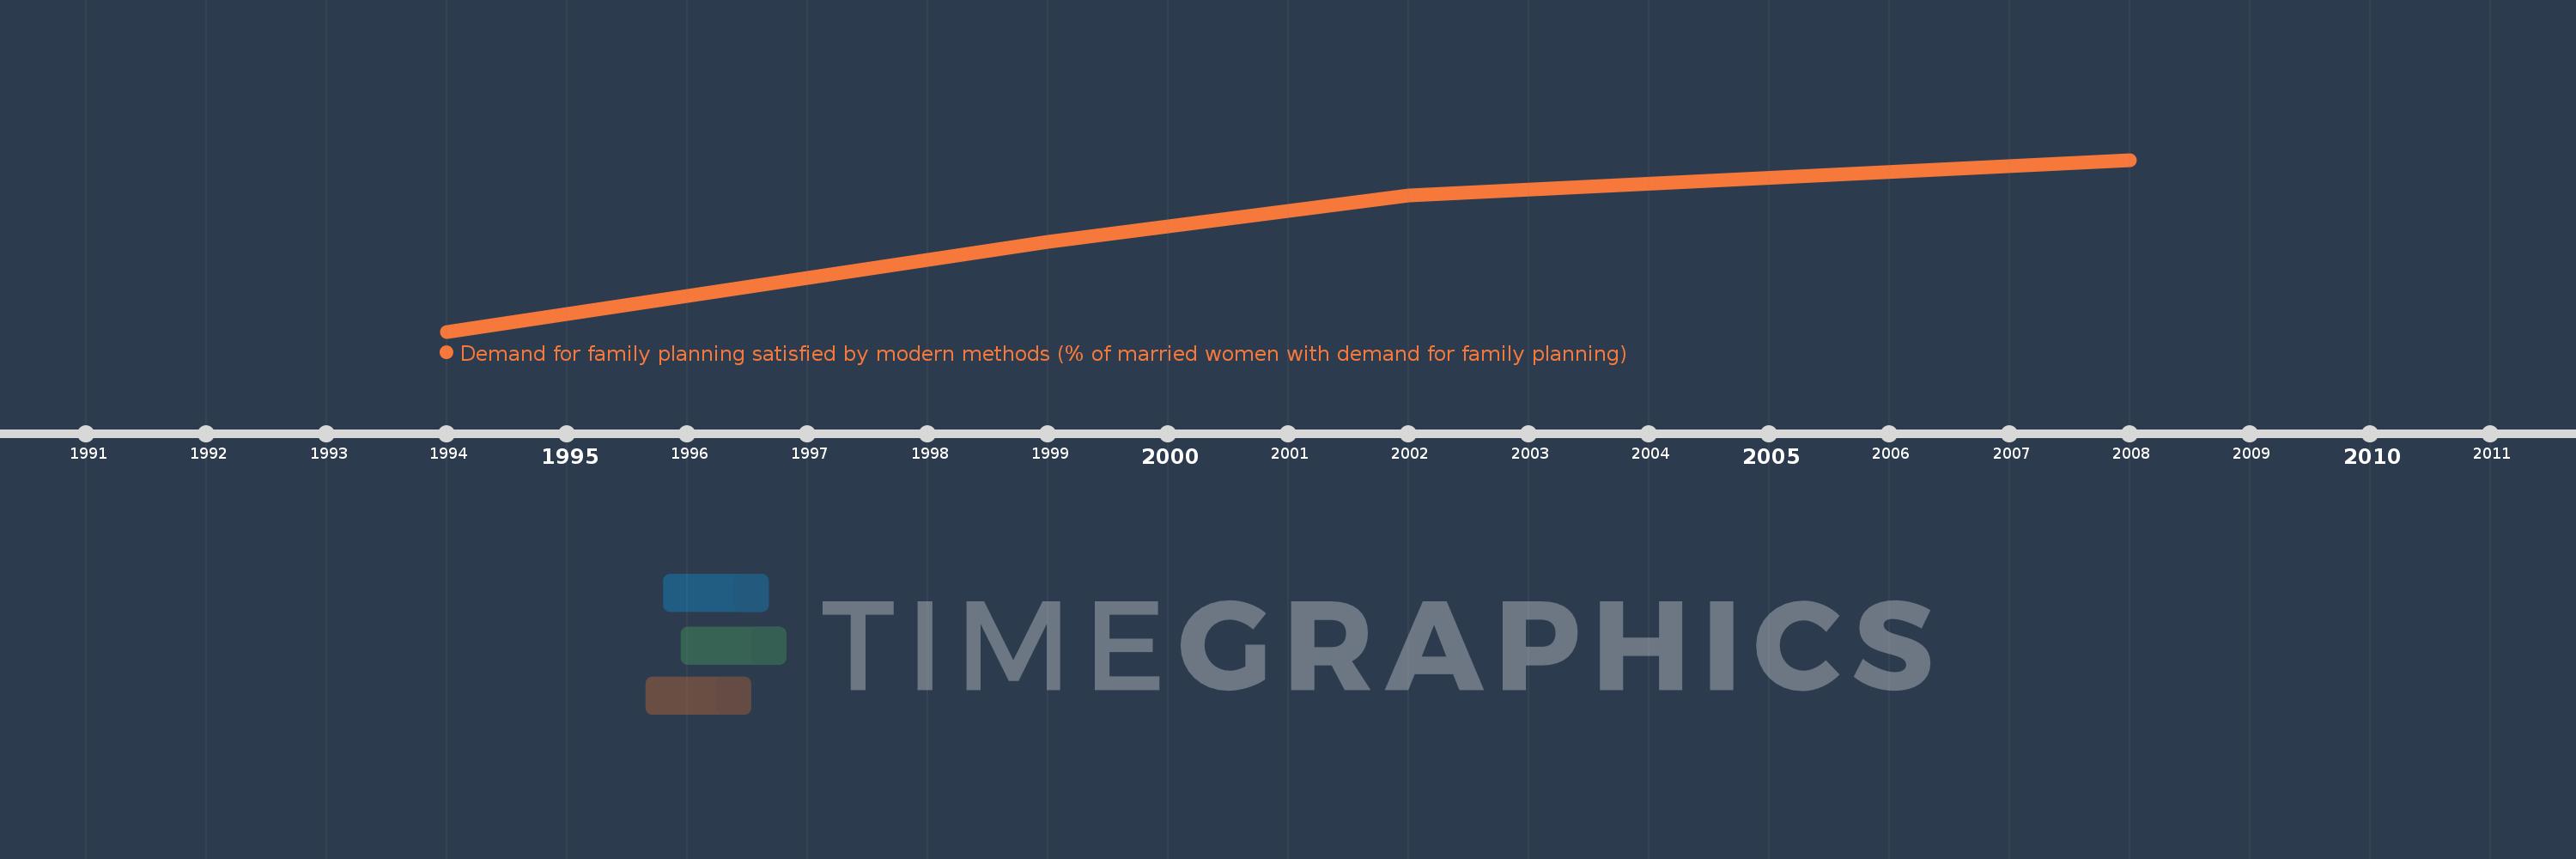
Demand for family planning satisfied by modern methods (% of married women with demand for family planning)
2008,2002,1999,1994
This statistics in other country:
Timeline:
This timeline shows a graph from 1994 to 2008 of Nicaragua. No data until 1993. Number of actual observations by date: 4.
Source name:
World Development Indicators
Source organization:
Demographic and Health Surveys (DHS).
Categories, topics:
Health
Last updated:
apr 23, 2017
Indicators value changes by year
At the date of observation
Value
Absolute change
Change from previous value
jan 1, 1994
61.8
+61.8
0.0%
jan 1, 1999
73.4
+11.6
18.77%
jan 1, 2002
79.4
+6.0
8.17%
jan 1, 2008
84.0
+4.6
5.79%
Ranking of countries by current statistics by years


Comments: