30
/
AIzaSyAYiBZKx7MnpbEhh9jyipgxe19OcubqV5w
April 1, 2024
284425
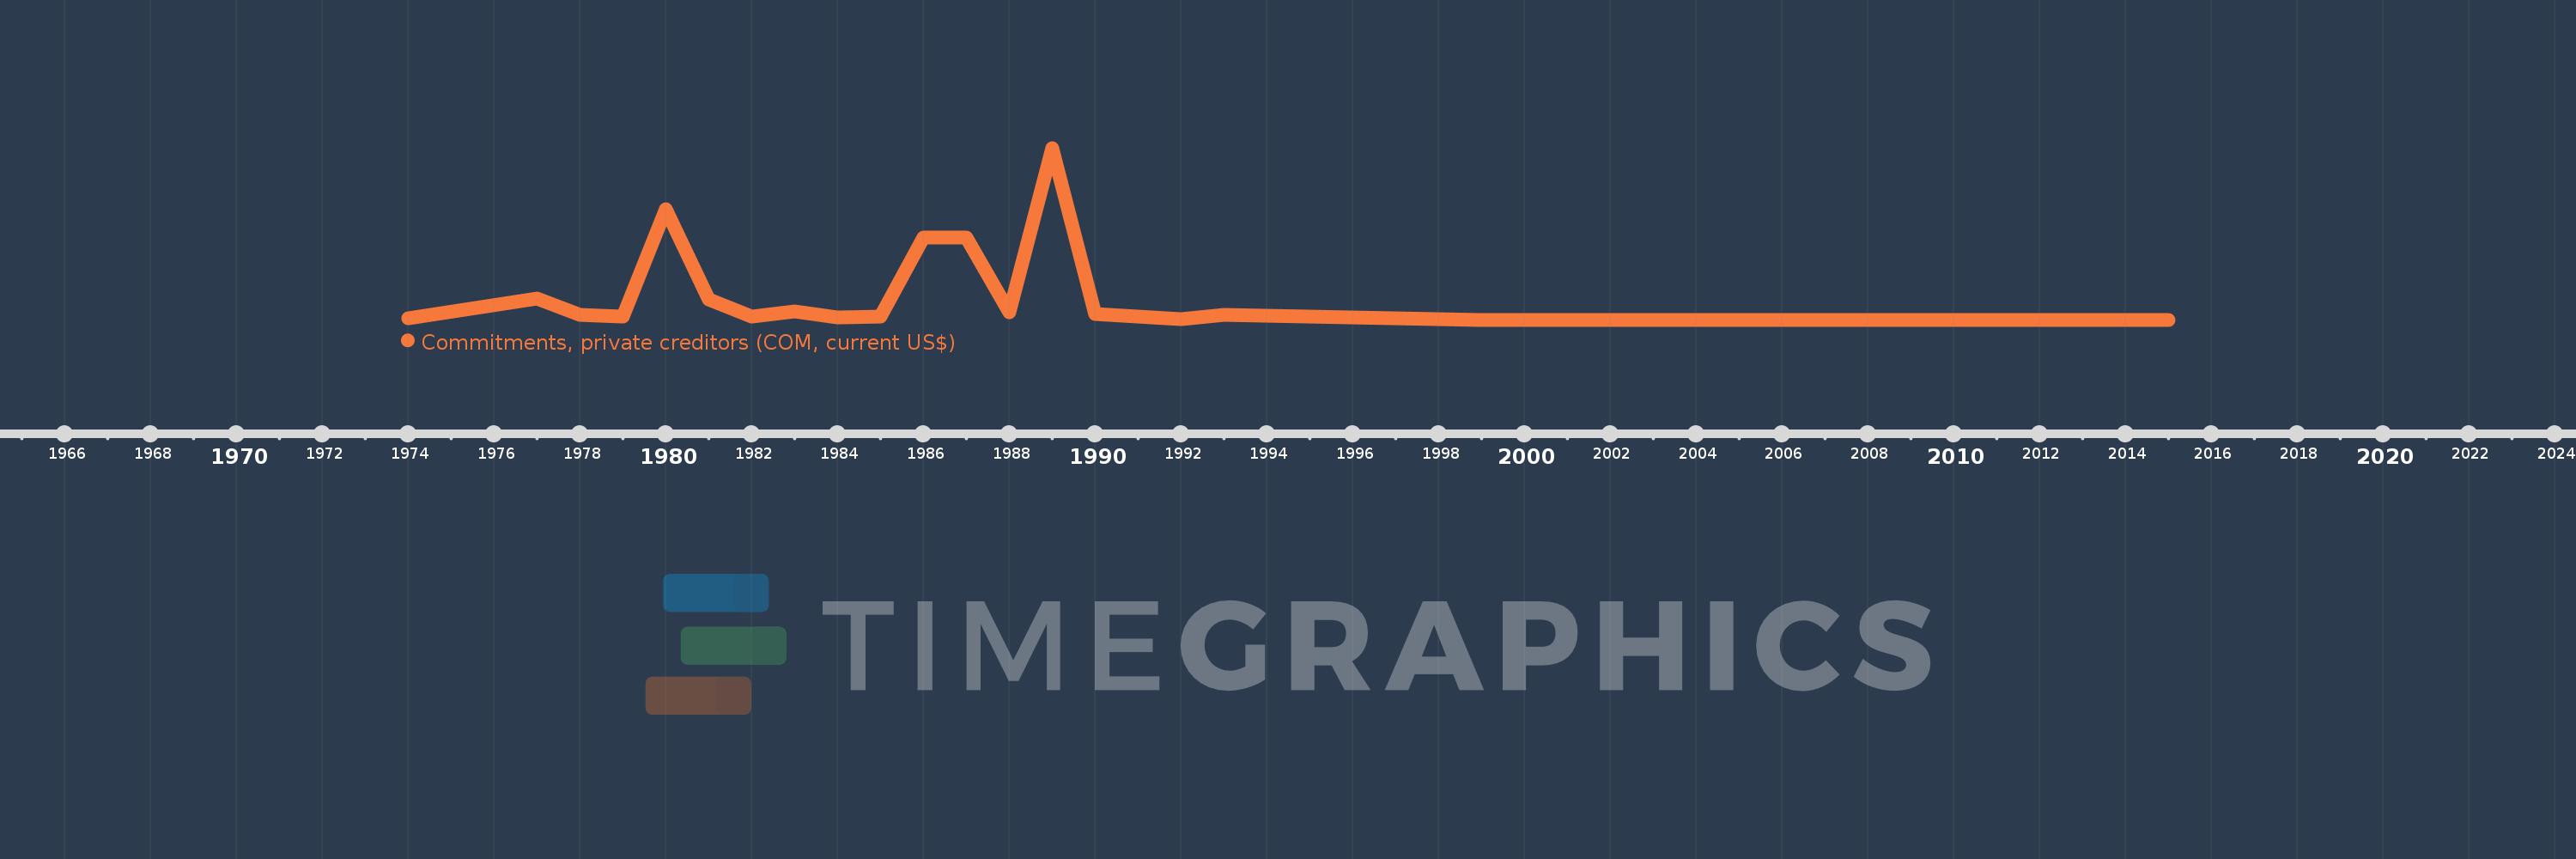
Yemen, Rep.
YEM
true
2
1
Commitments, private creditors (COM, current US$)
2015,2006,2005,2004,2003,2002,2001,2000,1999,1993,1992,1990,1989,1988,1987,1986,1985,1984,1983,1982,1981,1980,1979,1978,1977,1974
