29
/
en
AIzaSyAYiBZKx7MnpbEhh9jyipgxe19OcubqV5w
April 1, 2024
251709
St. Vincent and the Grenadines
VCT
true
2
1
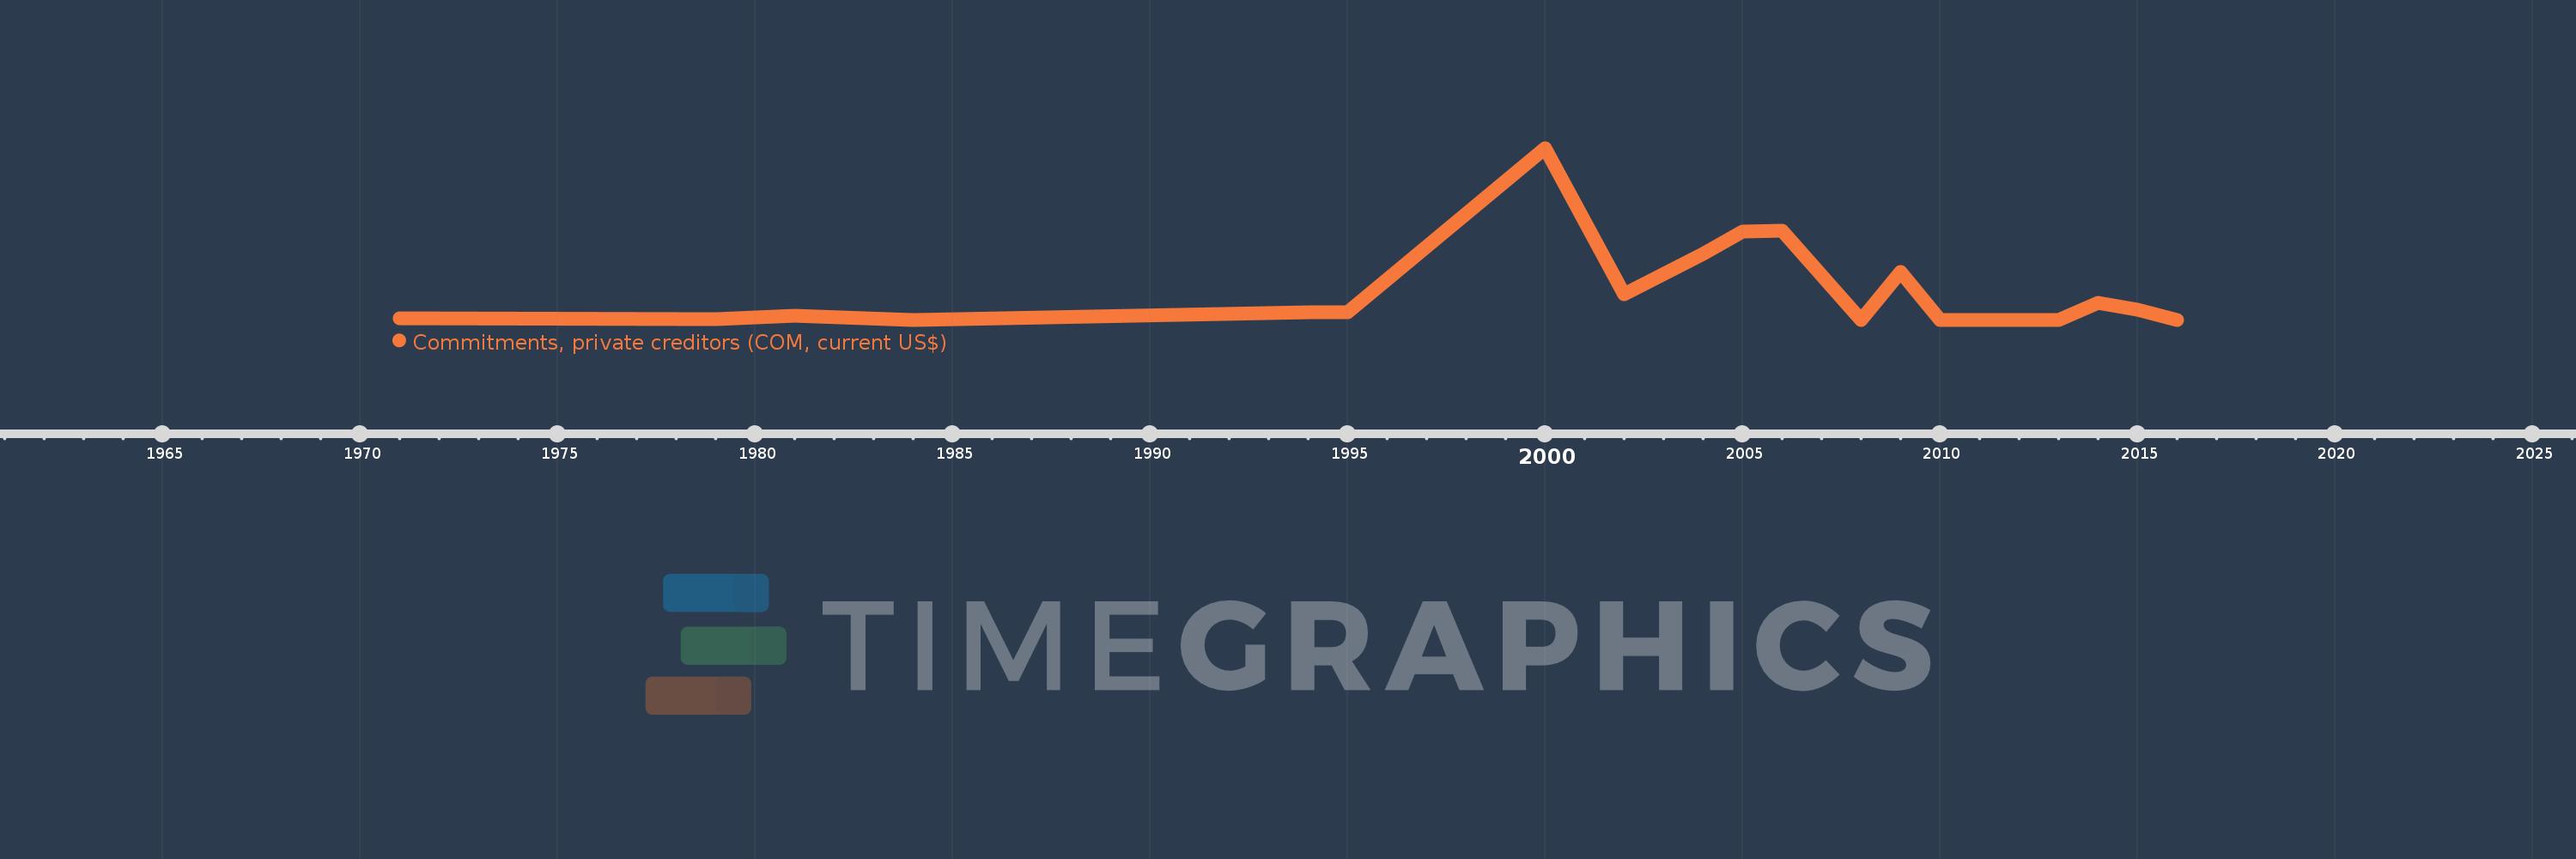
Commitments, private creditors (COM, current US$)
2016,2015,2014,2013,2012,2011,2010,2009,2008,2006,2005,2004,2002,2000,1995,1994,1984,1981,1979,1971
This statistics in other country:
Timeline:
This timeline shows a graph from 1971 to 2016 of St. Vincent and the Grenadines. No data until 1970. Number of actual observations by date: 20.
Source name:
World Development Indicators
Source organization:
World Bank, International Debt Statistics.
Categories, topics:
External Debt
Last updated:
apr 23, 2017
Indicators value changes by year
Maximum:
57.882 mln
jan 1, 2000
At the date of observation
Value
Absolute change
Change from previous value
jan 1, 1971
360.0K
+360.0K
0.0%
jan 1, 1979
223.0K
-137.0K
-38.06%
jan 1, 1981
1.312 mln
+1.089 mln
488.34%
jan 1, 1984
19.0K
-1.293 mln
-98.55%
jan 1, 1994
2.4 mln
+2.381 mln
12.53K%
jan 1, 1995
2.4 mln
0.0
0.0%
jan 1, 2000
57.882 mln
+55.482 mln
2.31K%
jan 1, 2002
8.7 mln
-49.182 mln
-84.97%
jan 1, 2004
22.222 mln
+13.522 mln
155.43%
jan 1, 2005
29.815 mln
+7.593 mln
34.17%
jan 1, 2006
30.0 mln
+185.0K
0.62%
jan 1, 2008
0.0
-30.0 mln
-100.0%
jan 1, 2009
16.0 mln
+16.0 mln
%
jan 1, 2010
0.0
-16.0 mln
-100.0%
jan 1, 2014
5.598 mln
+5.598 mln
%
jan 1, 2015
3.334 mln
-2.264 mln
-40.44%
jan 1, 2016
0.0
-3.334 mln
-100.0%
Ranking of countries by current statistics by years


Comments: