29
/
en
AIzaSyAYiBZKx7MnpbEhh9jyipgxe19OcubqV5w
April 1, 2024
283661
West Bank and Gaza
PSE
true
2
1
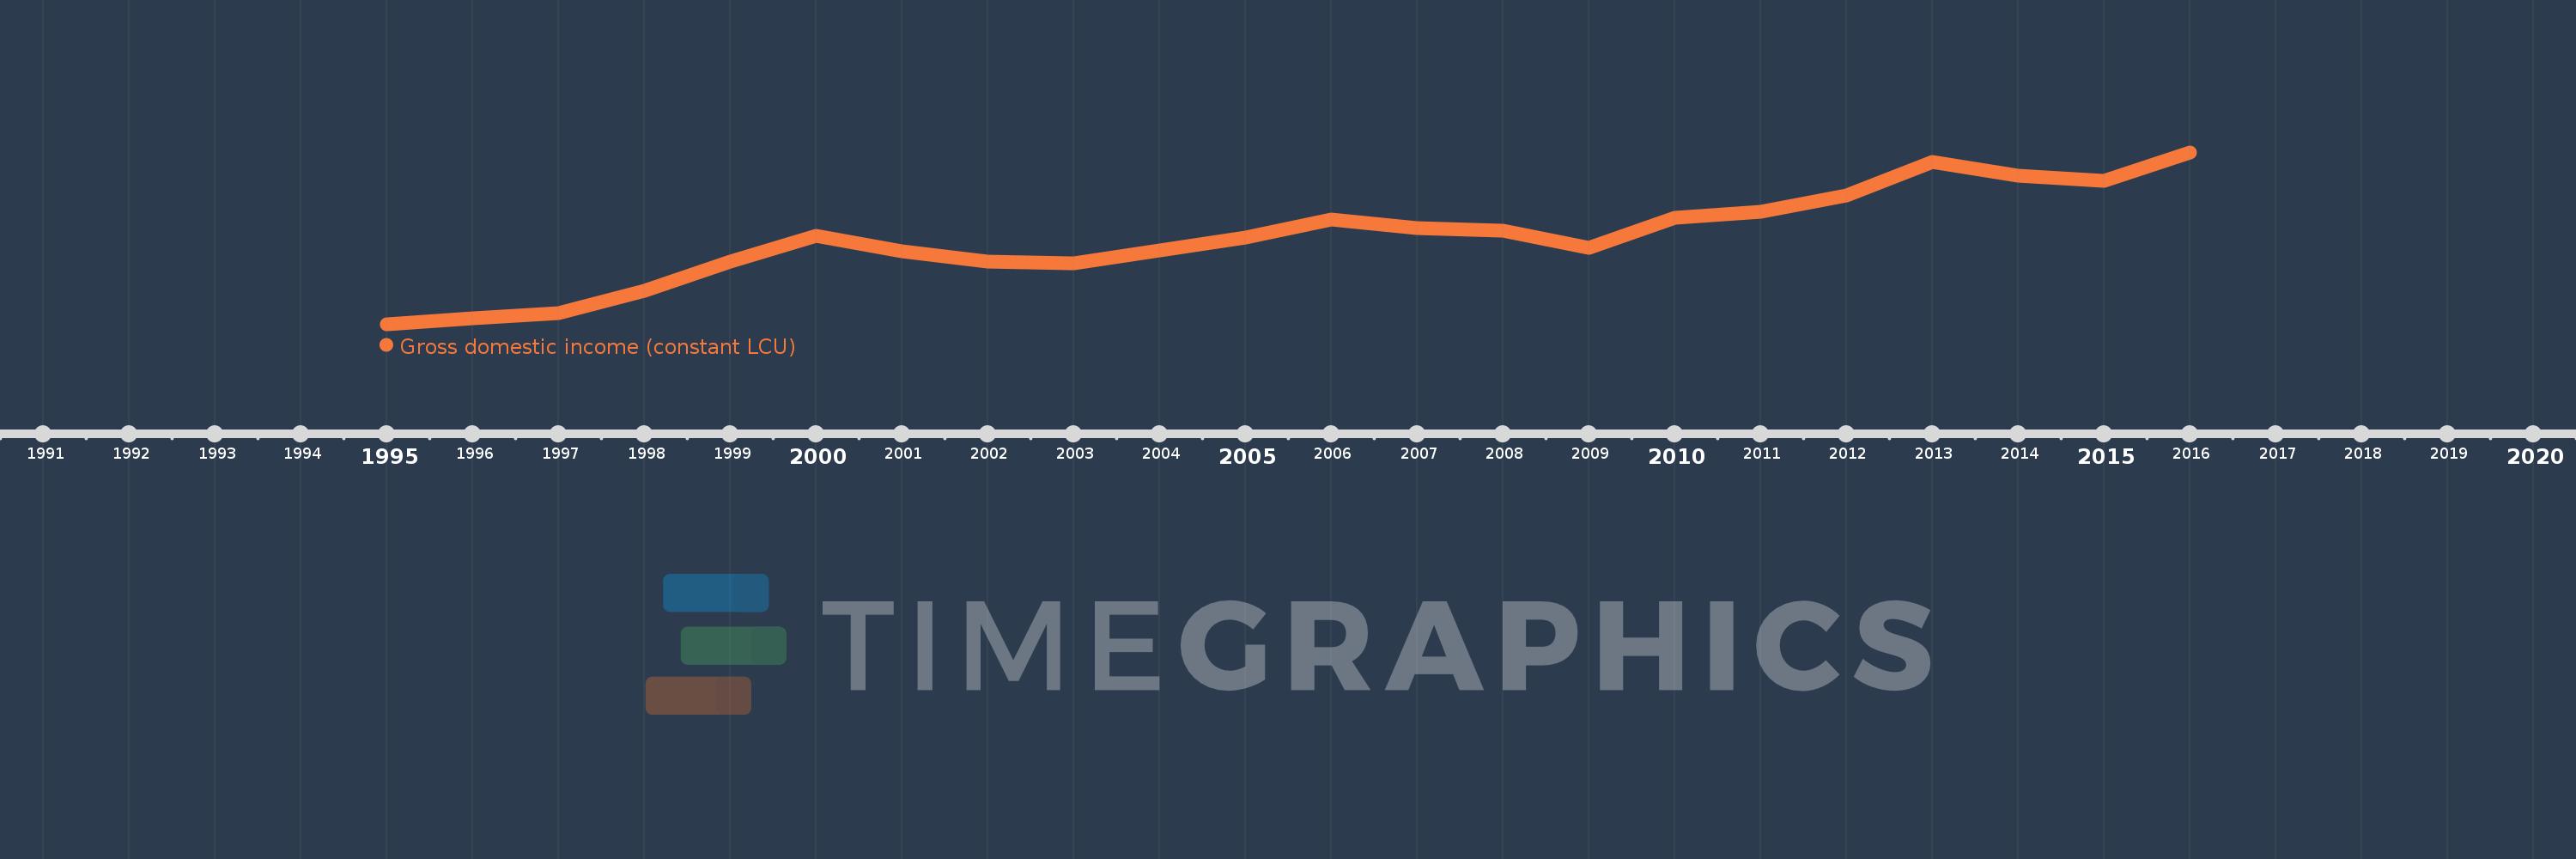
Gross domestic income (constant LCU)
2016,2015,2014,2013,2012,2011,2010,2009,2008,2007,2006,2005,2004,2003,2002,2001,2000,1999,1998,1997,1996,1995
This statistics in other country:
AlbaniaAlgeriaAngolaAntigua and BarbudaArgentinaArmeniaAustraliaAustriaAzerbaijanBahamas, TheBahrainBangladeshBarbadosBelarusBelgiumBelizeBeninBhutanBoliviaBosnia and HerzegovinaBotswanaBrazilBrunei DarussalamBulgariaBurkina FasoBurundiCabo VerdeCambodiaCameroonCanadaChadChileColombiaComorosCongo, Dem. Rep.Congo, Rep.Costa RicaCote d'IvoireCroatiaCubaCyprusCzech RepublicDenmarkDjiboutiDominican RepublicEcuadorEgypt, Arab Rep.El SalvadorEquatorial GuineaEritreaEstoniaEthiopiaFijiFinlandFranceGabonGambia, TheGeorgiaGermanyGhanaGreeceGuatemalaGuineaGuinea-BissauHaitiHondurasHong Kong SAR, ChinaHungaryIcelandIndiaIndonesiaIran, Islamic Rep.IrelandIsraelItalyJamaicaJapanJordanKazakhstanKenyaKorea, Rep.KosovoKuwaitKyrgyz RepublicLao PDRLatviaLebanonLiberiaLibyaLithuaniaLuxembourgMacao SAR, ChinaMacedonia, FYRMadagascarMalawiMalaysiaMaliMaltaMauritaniaMauritiusMexicoMoldovaMongoliaMontenegroMoroccoMozambiqueMyanmarNamibiaNepalNetherlandsNew ZealandNicaraguaNigerNigeriaNorwayOmanPakistanPanamaPapua New GuineaParaguayPeruPhilippinesPolandPortugalPuerto RicoQatarRomaniaRussian FederationRwandaSamoaSaudi ArabiaSenegalSerbiaSeychellesSierra LeoneSingaporeSlovak RepublicSloveniaSomaliaSouth AfricaSouth SudanSpainSri LankaSudanSurinameSwazilandSwedenSwitzerlandSyrian Arab RepublicTajikistanTanzaniaThailandTimor-LesteTogoTrinidad and TobagoTunisiaTurkeyTurkmenistanUgandaUkraineUnited Arab EmiratesUnited KingdomUnited StatesUruguayUzbekistanVanuatuVenezuela, RBVietnamWest Bank and GazaZambiaZimbabwe Timeline:
This timeline shows a graph from 1995 to 2016 of West Bank and Gaza. No data until 1994. Number of actual observations by date: 22.
Source name:
World Development Indicators
Source organization:
World Bank national accounts data, and OECD National Accounts data files.
Categories, topics:
Economy & Growth
Last updated:
apr 23, 2017
Indicators value changes by year
Minimum:
9.322 bln
jan 1, 1995
Maximum:
29.336 bln
jan 1, 2016
At the date of observation
Value
Absolute change
Change from previous value
jan 1, 1995
9.322 bln
+9.322 bln
0.0%
jan 1, 1996
9.964 bln
+641.498 mln
6.88%
jan 1, 1997
10.638 bln
+674.045 mln
6.77%
jan 1, 1998
13.189 bln
+2.551 bln
23.98%
jan 1, 1999
16.611 bln
+3.423 bln
25.95%
jan 1, 2000
19.62 bln
+3.009 bln
18.11%
jan 1, 2001
17.868 bln
-1.752 bln
-8.93%
jan 1, 2002
16.631 bln
-1.237 bln
-6.92%
jan 1, 2003
16.385 bln
-246.816 mln
-1.48%
jan 1, 2004
17.88 bln
+1.495 bln
9.12%
jan 1, 2005
19.403 bln
+1.524 bln
8.52%
jan 1, 2006
21.541 bln
+2.137 bln
11.01%
jan 1, 2007
20.497 bln
-1.044 bln
-4.85%
jan 1, 2008
20.23 bln
-266.759 mln
-1.3%
jan 1, 2009
18.187 bln
-2.043 bln
-10.1%
jan 1, 2010
21.755 bln
+3.568 bln
19.62%
jan 1, 2011
22.432 bln
+677.398 mln
3.11%
jan 1, 2012
24.287 bln
+1.855 bln
8.27%
jan 1, 2013
28.24 bln
+3.953 bln
16.27%
jan 1, 2014
26.646 bln
-1.594 bln
-5.64%
jan 1, 2015
26.032 bln
-614.319 mln
-2.31%
jan 1, 2016
29.336 bln
+3.304 bln
12.69%
Ranking of countries by current statistics by years


Comments: