29
/
en
AIzaSyAYiBZKx7MnpbEhh9jyipgxe19OcubqV5w
April 1, 2024
183912
Macedonia, FYR
MKD
true
2
1
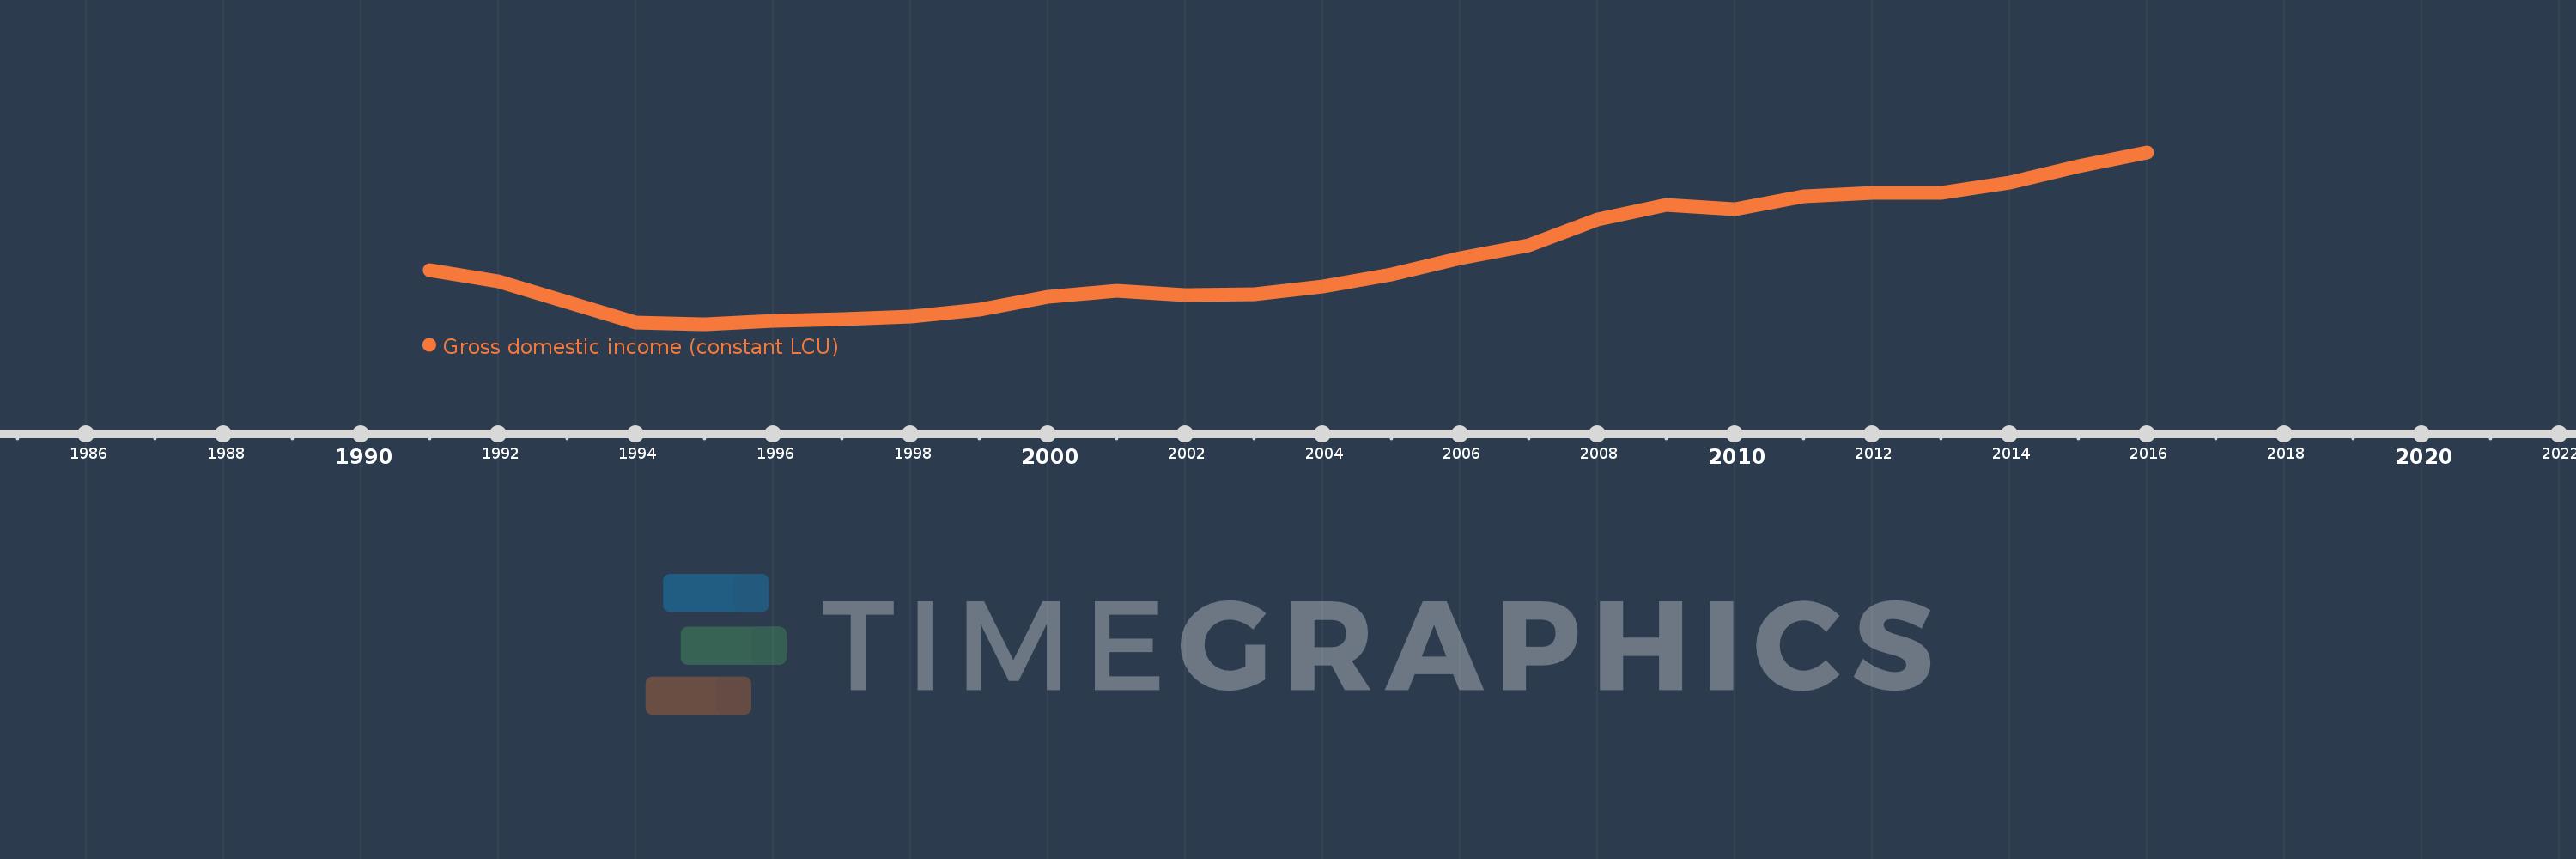
Gross domestic income (constant LCU)
2016,2015,2014,2013,2012,2011,2010,2009,2008,2007,2006,2005,2004,2003,2002,2001,2000,1999,1998,1997,1996,1995,1994,1993,1992,1991
This statistics in other country:
AlbaniaAlgeriaAngolaAntigua and BarbudaArgentinaArmeniaAustraliaAustriaAzerbaijanBahamas, TheBahrainBangladeshBarbadosBelarusBelgiumBelizeBeninBhutanBoliviaBosnia and HerzegovinaBotswanaBrazilBrunei DarussalamBulgariaBurkina FasoBurundiCabo VerdeCambodiaCameroonCanadaChadChileColombiaComorosCongo, Dem. Rep.Congo, Rep.Costa RicaCote d'IvoireCroatiaCubaCyprusCzech RepublicDenmarkDjiboutiDominican RepublicEcuadorEgypt, Arab Rep.El SalvadorEquatorial GuineaEritreaEstoniaEthiopiaFijiFinlandFranceGabonGambia, TheGeorgiaGermanyGhanaGreeceGuatemalaGuineaGuinea-BissauHaitiHondurasHong Kong SAR, ChinaHungaryIcelandIndiaIndonesiaIran, Islamic Rep.IrelandIsraelItalyJamaicaJapanJordanKazakhstanKenyaKorea, Rep.KosovoKuwaitKyrgyz RepublicLao PDRLatviaLebanonLiberiaLibyaLithuaniaLuxembourgMacao SAR, ChinaMacedonia, FYRMadagascarMalawiMalaysiaMaliMaltaMauritaniaMauritiusMexicoMoldovaMongoliaMontenegroMoroccoMozambiqueMyanmarNamibiaNepalNetherlandsNew ZealandNicaraguaNigerNigeriaNorwayOmanPakistanPanamaPapua New GuineaParaguayPeruPhilippinesPolandPortugalPuerto RicoQatarRomaniaRussian FederationRwandaSamoaSaudi ArabiaSenegalSerbiaSeychellesSierra LeoneSingaporeSlovak RepublicSloveniaSomaliaSouth AfricaSouth SudanSpainSri LankaSudanSurinameSwazilandSwedenSwitzerlandSyrian Arab RepublicTajikistanTanzaniaThailandTimor-LesteTogoTrinidad and TobagoTunisiaTurkeyTurkmenistanUgandaUkraineUnited Arab EmiratesUnited KingdomUnited StatesUruguayUzbekistanVanuatuVenezuela, RBVietnamWest Bank and GazaZambiaZimbabwe Timeline:
This timeline shows a graph from 1991 to 2016 of Macedonia, FYR. No data until 1990. Number of actual observations by date: 26.
Source name:
World Development Indicators
Source organization:
World Bank national accounts data, and OECD National Accounts data files.
Categories, topics:
Economy & Growth
Last updated:
apr 23, 2017
Indicators value changes by year
Minimum:
239.277 bln
jan 1, 1995
Maximum:
420.113 bln
jan 1, 2016
At the date of observation
Value
Absolute change
Change from previous value
jan 1, 1991
295.782 bln
+295.782 bln
0.0%
jan 1, 1992
284.212 bln
-11.57 bln
-3.91%
jan 1, 1993
262.504 bln
-21.708 bln
-7.64%
jan 1, 1994
240.971 bln
-21.533 bln
-8.2%
jan 1, 1995
239.277 bln
-1.694 bln
-0.7%
jan 1, 1996
242.475 bln
+3.198 bln
1.34%
jan 1, 1997
244.928 bln
+2.452 bln
1.01%
jan 1, 1998
247.19 bln
+2.263 bln
0.92%
jan 1, 1999
254.841 bln
+7.65 bln
3.09%
jan 1, 2000
268.293 bln
+13.453 bln
5.28%
jan 1, 2001
274.45 bln
+6.157 bln
2.29%
jan 1, 2002
269.824 bln
-4.625 bln
-1.69%
jan 1, 2003
270.93 bln
+1.106 bln
0.41%
jan 1, 2004
279.039 bln
+8.109 bln
2.99%
jan 1, 2005
291.345 bln
+12.306 bln
4.41%
jan 1, 2006
308.447 bln
+17.102 bln
5.87%
jan 1, 2007
322.748 bln
+14.301 bln
4.64%
jan 1, 2008
349.241 bln
+26.493 bln
8.21%
jan 1, 2009
365.23 bln
+15.989 bln
4.58%
jan 1, 2010
360.615 bln
-4.615 bln
-1.26%
jan 1, 2011
374.044 bln
+13.429 bln
3.72%
jan 1, 2012
377.563 bln
+3.518 bln
0.94%
jan 1, 2013
377.339 bln
-223.69 mln
-0.06%
jan 1, 2014
388.504 bln
+11.165 bln
2.96%
jan 1, 2015
405.746 bln
+17.242 bln
4.44%
jan 1, 2016
420.113 bln
+14.367 bln
3.54%
Ranking of countries by current statistics by years


Comments: