29
/
en
AIzaSyAYiBZKx7MnpbEhh9jyipgxe19OcubqV5w
April 1, 2024
282248
Vietnam
VNM
true
2
1
Final consumption expenditure (current US$)
2016,2015,2014,2013,2012,2011,2010,2009,2008,2007,2006,2005,2004,2003,2002,2001,2000,1999,1998,1997,1996,1995,1994,1993,1992,1991,1990
This statistics in other country:
AfghanistanAlbaniaAlgeriaAngolaAntigua and BarbudaArgentinaArmeniaArubaAustraliaAustriaAzerbaijanBahamas, TheBahrainBangladeshBarbadosBelarusBelgiumBelizeBeninBermudaBhutanBoliviaBosnia and HerzegovinaBotswanaBrazilBrunei DarussalamBulgariaBurkina FasoBurundiCabo VerdeCambodiaCameroonCanadaCentral African RepublicChadChileChinaColombiaComorosCongo, Dem. Rep.Congo, Rep.Costa RicaCote d'IvoireCroatiaCubaCyprusCzech RepublicDenmarkDjiboutiDominicaDominican RepublicEcuadorEgypt, Arab Rep.El SalvadorEquatorial GuineaEritreaEstoniaEthiopiaFaroe IslandsFijiFinlandFranceGabonGambia, TheGeorgiaGermanyGhanaGreeceGrenadaGuatemalaGuineaGuinea-BissauGuyanaHaitiHondurasHong Kong SAR, ChinaHungaryIcelandIndiaIndonesiaIran, Islamic Rep.IrelandIsraelItalyJamaicaJapanJordanKazakhstanKenyaKiribatiKorea, Rep.KosovoKuwaitKyrgyz RepublicLao PDRLatviaLebanonLesothoLiberiaLibyaLithuaniaLuxembourgMacao SAR, ChinaMacedonia, FYRMadagascarMalawiMalaysiaMaliMaltaMauritaniaMauritiusMexicoMicronesia, Fed. Sts.MoldovaMongoliaMontenegroMoroccoMozambiqueNamibiaNepalNetherlandsNew CaledoniaNew ZealandNicaraguaNigerNigeriaNorwayOmanPakistanPanamaPapua New GuineaParaguayPeruPhilippinesPolandPortugalPuerto RicoQatarRomaniaRussian FederationRwandaSaudi ArabiaSenegalSerbiaSeychellesSierra LeoneSingaporeSlovak RepublicSloveniaSolomon IslandsSomaliaSouth AfricaSouth SudanSpainSri LankaSt. Kitts and NevisSt. LuciaSt. Vincent and the GrenadinesSudanSurinameSwazilandSwedenSwitzerlandSyrian Arab RepublicTajikistanTanzaniaThailandTimor-LesteTogoTongaTrinidad and TobagoTunisiaTurkeyUgandaUkraineUnited Arab EmiratesUnited KingdomUnited StatesUruguayUzbekistanVanuatuVenezuela, RBVietnamWest Bank and GazaYemen, Rep.ZambiaZimbabwe Timeline:
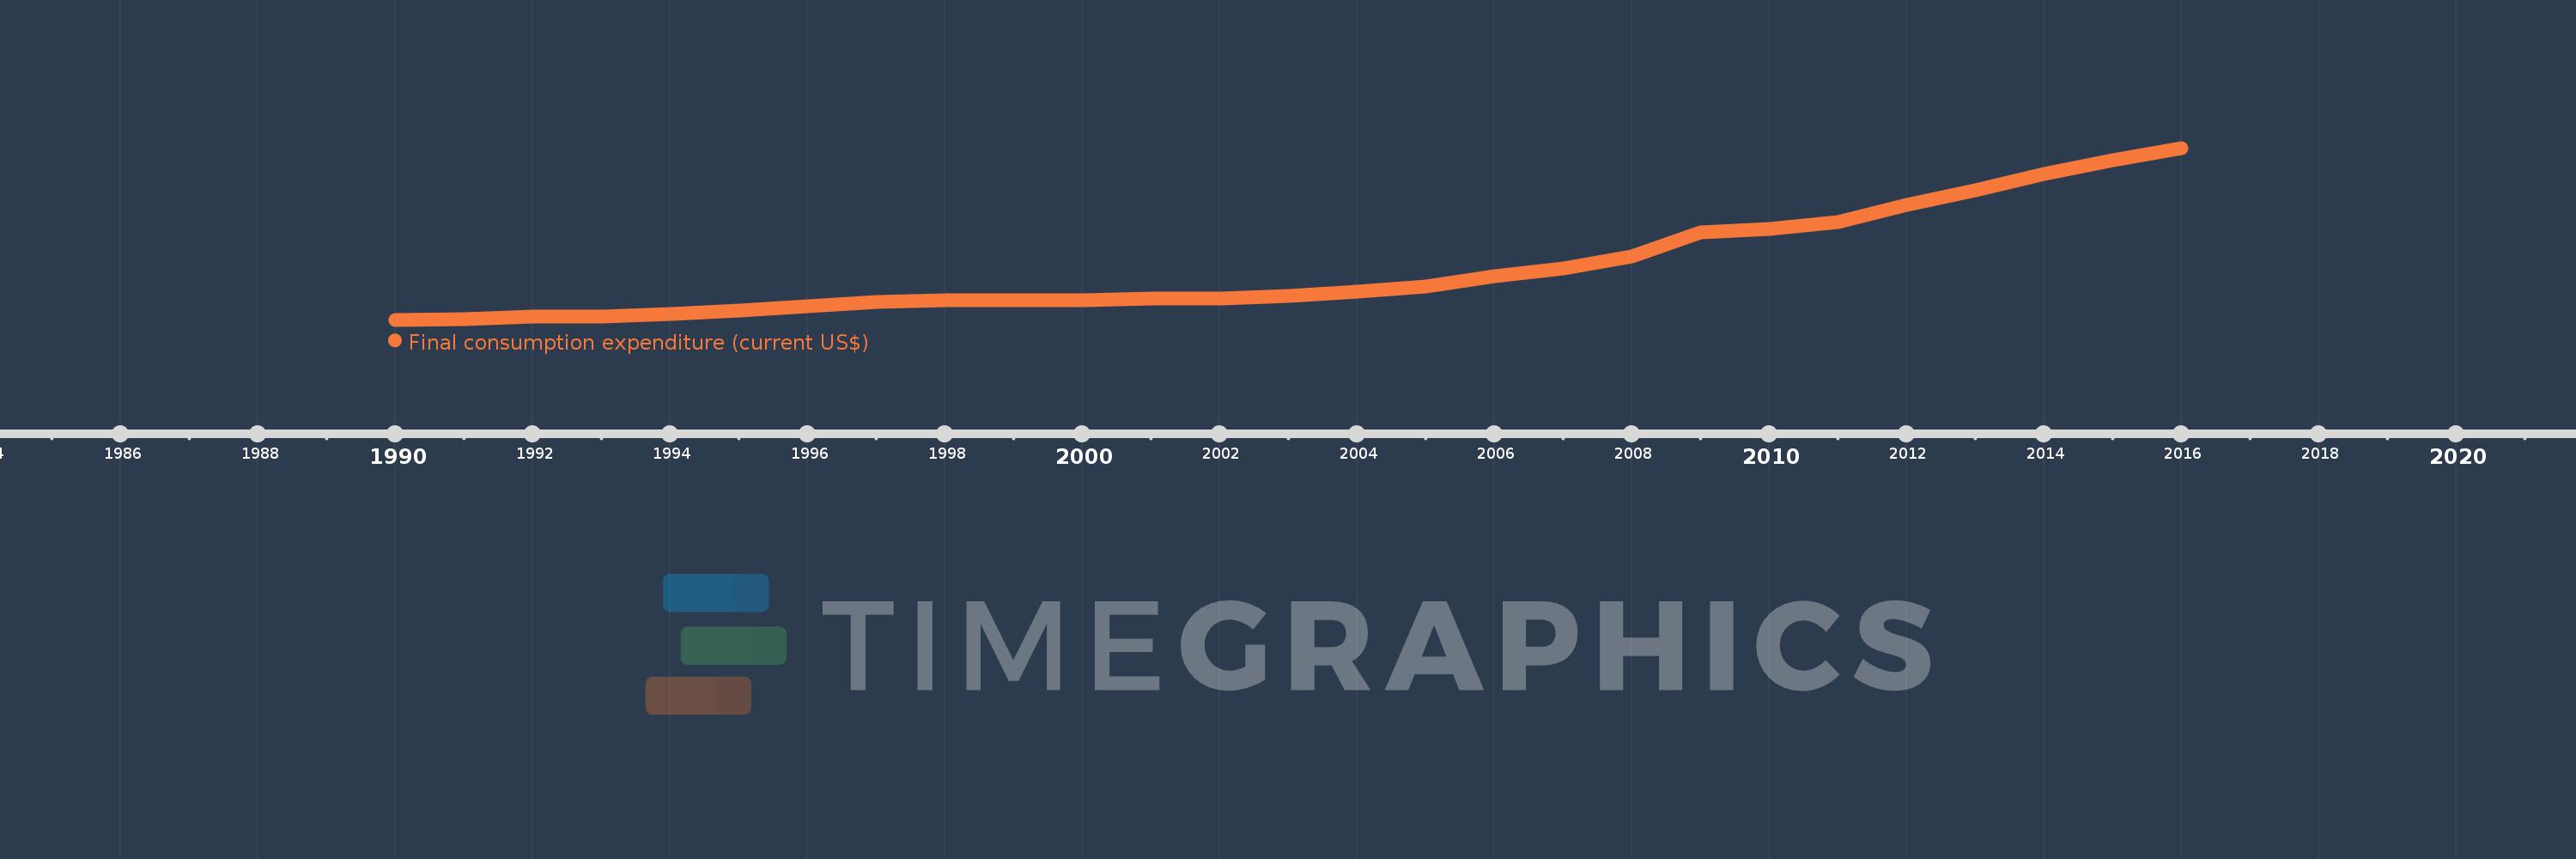
This timeline shows a graph from 1990 to 2016 of Vietnam. No data until 1989. Number of actual observations by date: 27.
Source name:
World Development Indicators
Source organization:
World Bank national accounts data, and OECD National Accounts data files.
Categories, topics:
Economy & Growth
Last updated:
apr 23, 2017
Indicators value changes by year
Minimum:
6.015 bln
jan 1, 1990
Maximum:
143.835 bln
jan 1, 2016
At the date of observation
Value
Absolute change
Change from previous value
jan 1, 1990
6.015 bln
+6.015 bln
0.0%
jan 1, 1991
6.284 bln
+268.875 mln
4.47%
jan 1, 1992
8.642 bln
+2.359 bln
37.54%
jan 1, 1993
8.509 bln
-133.838 mln
-1.55%
jan 1, 1994
10.969 bln
+2.46 bln
28.92%
jan 1, 1995
13.504 bln
+2.536 bln
23.12%
jan 1, 1996
16.962 bln
+3.458 bln
25.6%
jan 1, 1997
20.415 bln
+3.453 bln
20.36%
jan 1, 1998
21.448 bln
+1.033 bln
5.06%
jan 1, 1999
21.363 bln
-85.072 mln
-0.4%
jan 1, 2000
21.637 bln
+274.092 mln
1.28%
jan 1, 2001
22.717 bln
+1.08 bln
4.99%
jan 1, 2002
23.267 bln
+549.547 mln
2.42%
jan 1, 2003
25.01 bln
+1.743 bln
7.49%
jan 1, 2004
28.706 bln
+3.696 bln
14.78%
jan 1, 2005
32.469 bln
+3.763 bln
13.11%
jan 1, 2006
40.893 bln
+8.424 bln
25.94%
jan 1, 2007
46.872 bln
+5.979 bln
14.62%
jan 1, 2008
57.025 bln
+10.152 bln
21.66%
jan 1, 2009
75.834 bln
+18.809 bln
32.98%
jan 1, 2010
78.739 bln
+2.905 bln
3.83%
jan 1, 2011
84.114 bln
+5.375 bln
6.83%
jan 1, 2012
97.939 bln
+13.825 bln
16.44%
jan 1, 2013
109.738 bln
+11.799 bln
12.05%
jan 1, 2014
122.617 bln
+12.879 bln
11.74%
jan 1, 2015
134.199 bln
+11.582 bln
9.45%
jan 1, 2016
143.835 bln
+9.635 bln
7.18%
Ranking of countries by current statistics by years


Comments: