29
/
en
AIzaSyAYiBZKx7MnpbEhh9jyipgxe19OcubqV5w
April 1, 2024
260853
Tanzania
TZA
true
2
1
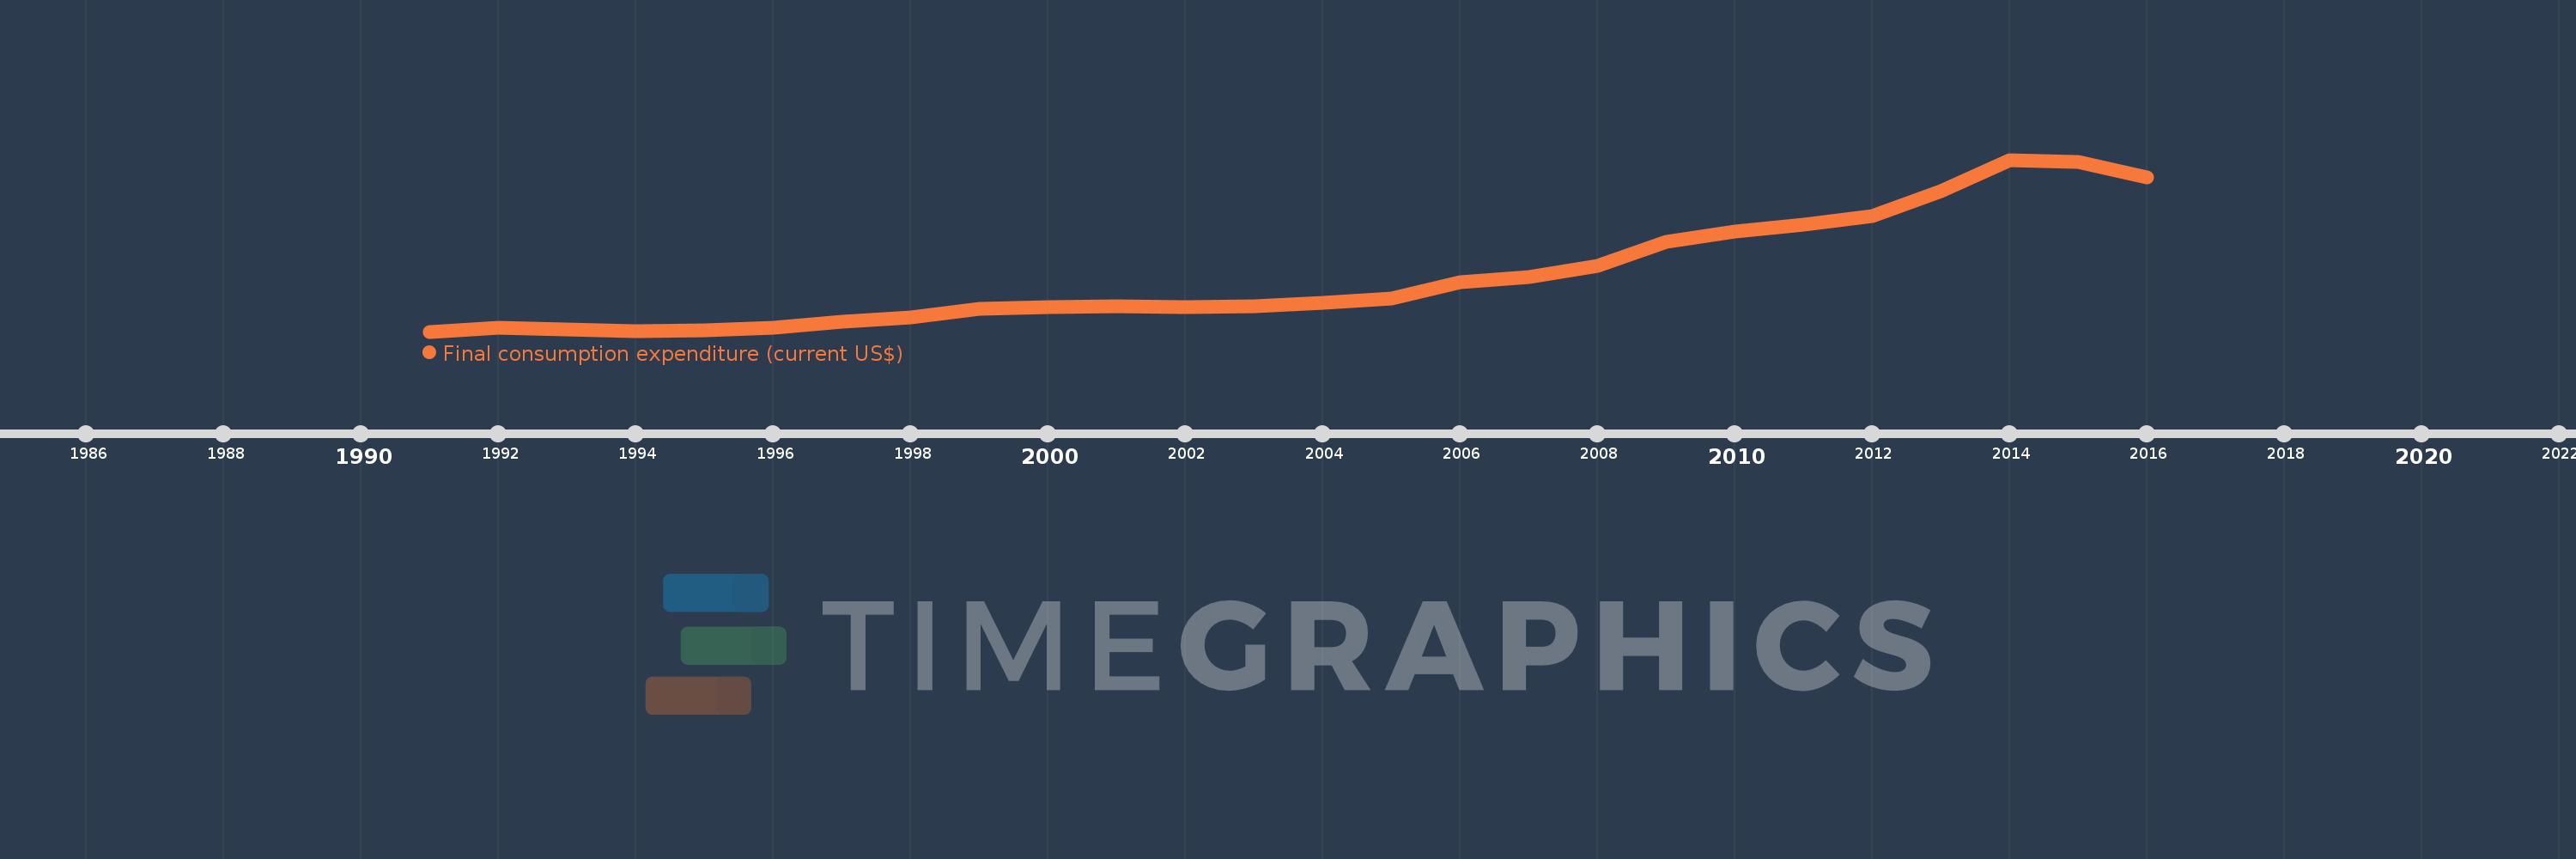
Final consumption expenditure (current US$)
2016,2015,2014,2013,2012,2011,2010,2009,2008,2007,2006,2005,2004,2003,2002,2001,2000,1999,1998,1997,1996,1995,1994,1993,1992,1991
This statistics in other country:
AfghanistanAlbaniaAlgeriaAngolaAntigua and BarbudaArgentinaArmeniaArubaAustraliaAustriaAzerbaijanBahamas, TheBahrainBangladeshBarbadosBelarusBelgiumBelizeBeninBermudaBhutanBoliviaBosnia and HerzegovinaBotswanaBrazilBrunei DarussalamBulgariaBurkina FasoBurundiCabo VerdeCambodiaCameroonCanadaCentral African RepublicChadChileChinaColombiaComorosCongo, Dem. Rep.Congo, Rep.Costa RicaCote d'IvoireCroatiaCubaCyprusCzech RepublicDenmarkDjiboutiDominicaDominican RepublicEcuadorEgypt, Arab Rep.El SalvadorEquatorial GuineaEritreaEstoniaEthiopiaFaroe IslandsFijiFinlandFranceGabonGambia, TheGeorgiaGermanyGhanaGreeceGrenadaGuatemalaGuineaGuinea-BissauGuyanaHaitiHondurasHong Kong SAR, ChinaHungaryIcelandIndiaIndonesiaIran, Islamic Rep.IrelandIsraelItalyJamaicaJapanJordanKazakhstanKenyaKiribatiKorea, Rep.KosovoKuwaitKyrgyz RepublicLao PDRLatviaLebanonLesothoLiberiaLibyaLithuaniaLuxembourgMacao SAR, ChinaMacedonia, FYRMadagascarMalawiMalaysiaMaliMaltaMauritaniaMauritiusMexicoMicronesia, Fed. Sts.MoldovaMongoliaMontenegroMoroccoMozambiqueNamibiaNepalNetherlandsNew CaledoniaNew ZealandNicaraguaNigerNigeriaNorwayOmanPakistanPanamaPapua New GuineaParaguayPeruPhilippinesPolandPortugalPuerto RicoQatarRomaniaRussian FederationRwandaSaudi ArabiaSenegalSerbiaSeychellesSierra LeoneSingaporeSlovak RepublicSloveniaSolomon IslandsSomaliaSouth AfricaSouth SudanSpainSri LankaSt. Kitts and NevisSt. LuciaSt. Vincent and the GrenadinesSudanSurinameSwazilandSwedenSwitzerlandSyrian Arab RepublicTajikistanTanzaniaThailandTimor-LesteTogoTongaTrinidad and TobagoTunisiaTurkeyUgandaUkraineUnited Arab EmiratesUnited KingdomUnited StatesUruguayUzbekistanVanuatuVenezuela, RBVietnamWest Bank and GazaYemen, Rep.ZambiaZimbabwe Timeline:
This timeline shows a graph from 1991 to 2016 of Tanzania. No data until 1990. Number of actual observations by date: 26.
Source name:
World Development Indicators
Source organization:
World Bank national accounts data, and OECD National Accounts data files.
Categories, topics:
Economy & Growth
Last updated:
apr 23, 2017
Indicators value changes by year
Minimum:
4.283 bln
jan 1, 1991
Maximum:
37.853 bln
jan 1, 2014
At the date of observation
Value
Absolute change
Change from previous value
jan 1, 1991
4.283 bln
+4.283 bln
0.0%
jan 1, 1992
4.987 bln
+703.945 mln
16.44%
jan 1, 1993
4.71 bln
-276.582 mln
-5.55%
jan 1, 1994
4.392 bln
-318.207 mln
-6.76%
jan 1, 1995
4.563 bln
+171.252 mln
3.9%
jan 1, 1996
5.012 bln
+449.239 mln
9.85%
jan 1, 1997
6.147 bln
+1.135 bln
22.65%
jan 1, 1998
7.119 bln
+971.557 mln
15.8%
jan 1, 1999
8.755 bln
+1.636 bln
22.98%
jan 1, 2000
8.998 bln
+243.272 mln
2.78%
jan 1, 2001
9.162 bln
+163.476 mln
1.82%
jan 1, 2002
9.016 bln
-145.614 mln
-1.59%
jan 1, 2003
9.192 bln
+176.24 mln
1.95%
jan 1, 2004
9.92 bln
+727.496 mln
7.91%
jan 1, 2005
10.754 bln
+833.979 mln
8.41%
jan 1, 2006
13.873 bln
+3.119 bln
29.0%
jan 1, 2007
14.942 bln
+1.069 bln
7.71%
jan 1, 2008
17.172 bln
+2.23 bln
14.92%
jan 1, 2009
21.879 bln
+4.708 bln
27.41%
jan 1, 2010
23.886 bln
+2.007 bln
9.17%
jan 1, 2011
25.137 bln
+1.25 bln
5.23%
jan 1, 2012
26.866 bln
+1.73 bln
6.88%
jan 1, 2013
31.735 bln
+4.869 bln
18.12%
jan 1, 2014
37.853 bln
+6.118 bln
19.28%
jan 1, 2015
37.463 bln
-390.172 mln
-1.03%
jan 1, 2016
34.433 bln
-3.031 bln
-8.09%
Ranking of countries by current statistics by years


Comments: