29
/
en
AIzaSyAYiBZKx7MnpbEhh9jyipgxe19OcubqV5w
April 1, 2024
282116
Vietnam
VNM
true
2
1
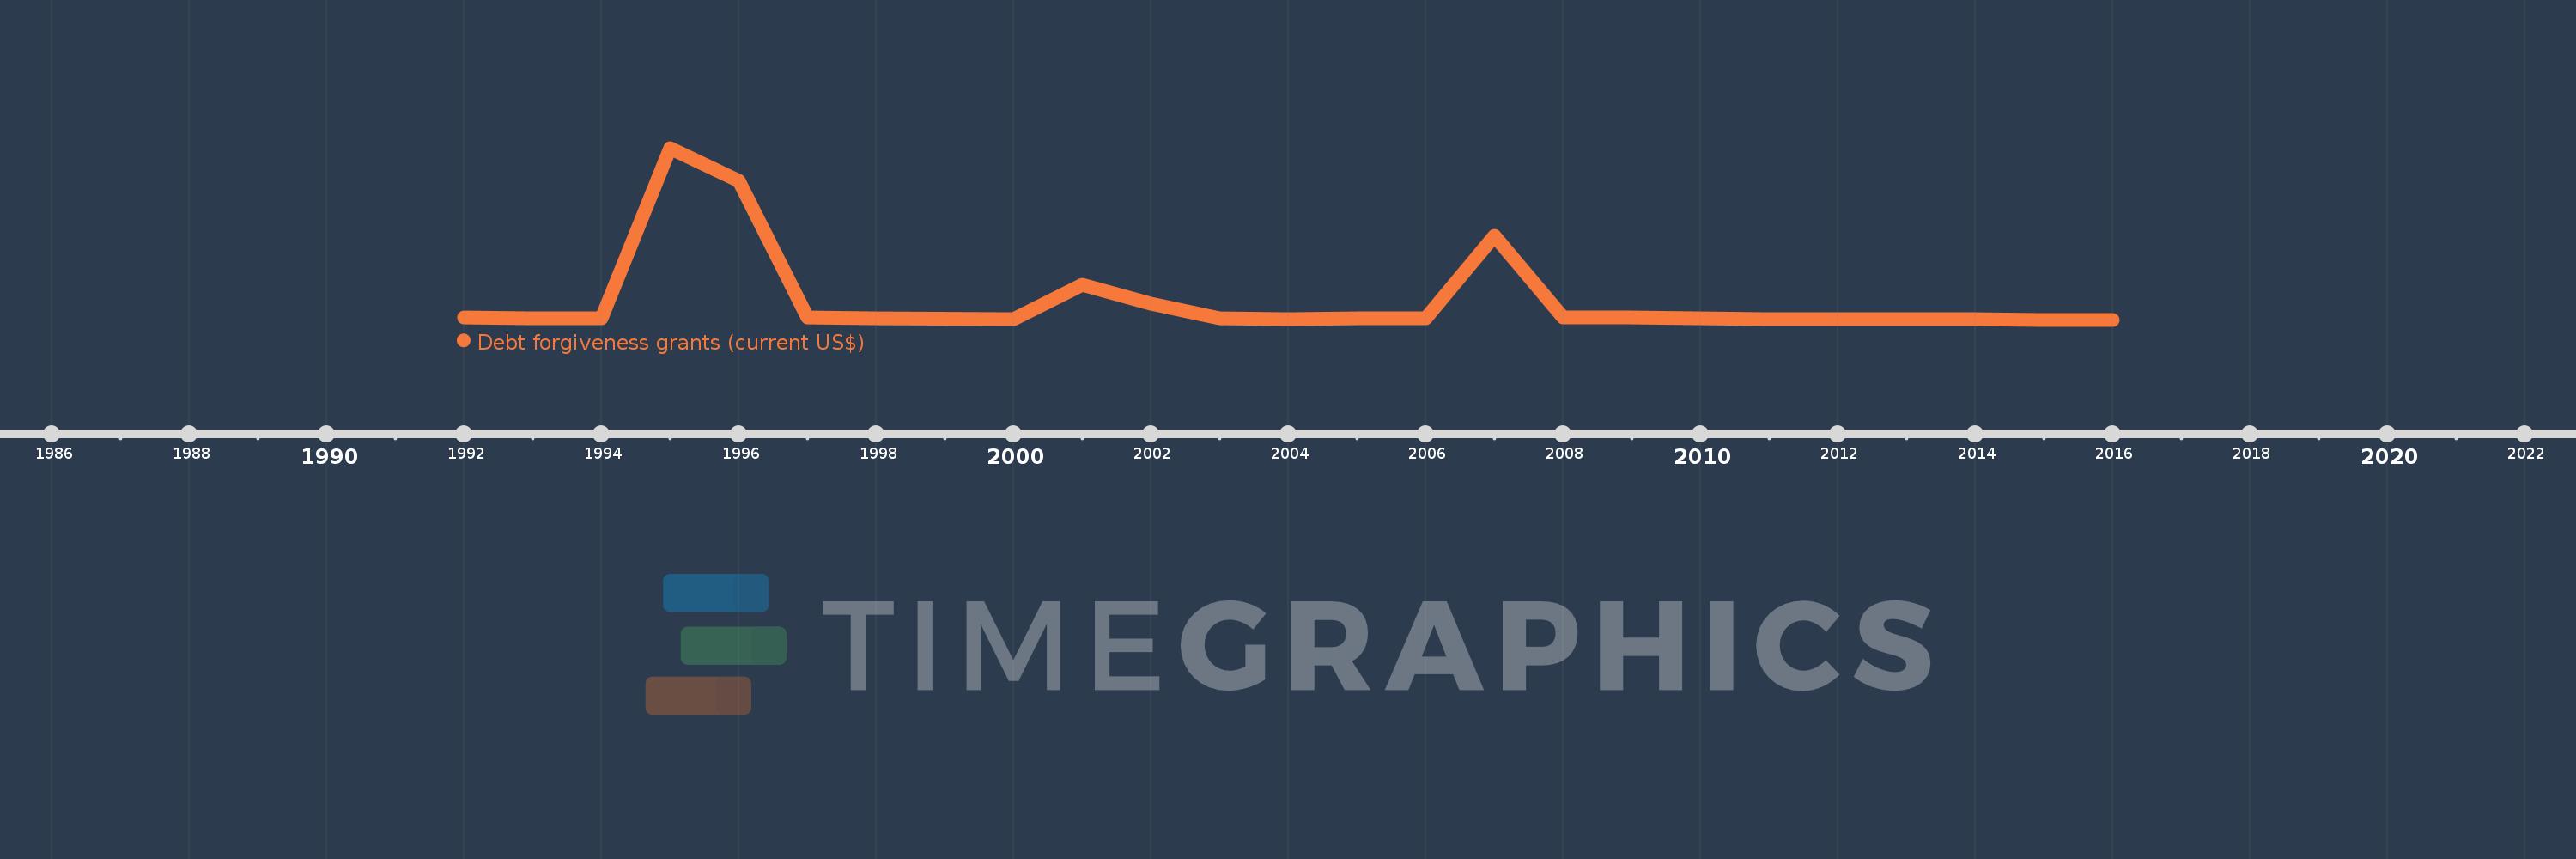
Debt forgiveness grants (current US$)
2016,2015,2014,2013,2012,2011,2010,2009,2008,2007,2006,2005,2004,2003,2002,2001,2000,1998,1997,1996,1995,1994,1993,1992
This statistics in other country:
Timeline:
This timeline shows a graph from 1992 to 2016 of Vietnam. No data until 1991. Number of actual observations by date: 24.
Source name:
World Development Indicators
Source organization:
Development Assistance Committee of the Organisation for Economic Co-operation and Development.
Categories, topics:
Aid Effectiveness, External Debt
Last updated:
apr 23, 2017
Indicators value changes by year
Maximum:
112.92 mln
jan 1, 1995
At the date of observation
Value
Absolute change
Change from previous value
jan 1, 1992
1.39 mln
+1.39 mln
0.0%
jan 1, 1993
1.05 mln
-340.0K
-24.46%
jan 1, 1994
990.0K
-60.0K
-5.71%
jan 1, 1995
112.92 mln
+111.93 mln
11.31K%
jan 1, 1996
91.52 mln
-21.4 mln
-18.95%
jan 1, 1997
1.27 mln
-90.25 mln
-98.61%
jan 1, 1998
1.01 mln
-260.0K
-20.47%
jan 1, 2000
640.0K
-370.0K
-36.63%
jan 1, 2001
23.0 mln
+22.36 mln
3.49K%
jan 1, 2002
10.54 mln
-12.46 mln
-54.17%
jan 1, 2003
760.0K
-9.78 mln
-92.79%
jan 1, 2004
690.0K
-70.0K
-9.21%
jan 1, 2005
700.0K
+10.0K
1.45%
jan 1, 2006
1.07 mln
+370.0K
52.86%
jan 1, 2007
55.06 mln
+53.99 mln
5.05K%
jan 1, 2008
1.54 mln
-53.52 mln
-97.2%
jan 1, 2009
1.71 mln
+170.0K
11.04%
jan 1, 2010
1000.0K
-710.0K
-41.52%
jan 1, 2011
460.0K
-540.0K
-54.0%
jan 1, 2012
450.0K
-10.0K
-2.17%
jan 1, 2013
150.0K
-300.0K
-66.67%
jan 1, 2014
170.0K
+20.0K
13.33%
jan 1, 2015
90.0K
-80.0K
-47.06%
jan 1, 2016
20.0K
-70.0K
-77.78%
Ranking of countries by current statistics by years


Comments: