29
/
en
AIzaSyAYiBZKx7MnpbEhh9jyipgxe19OcubqV5w
April 1, 2024
178715
Liberia
LBR
true
2
1
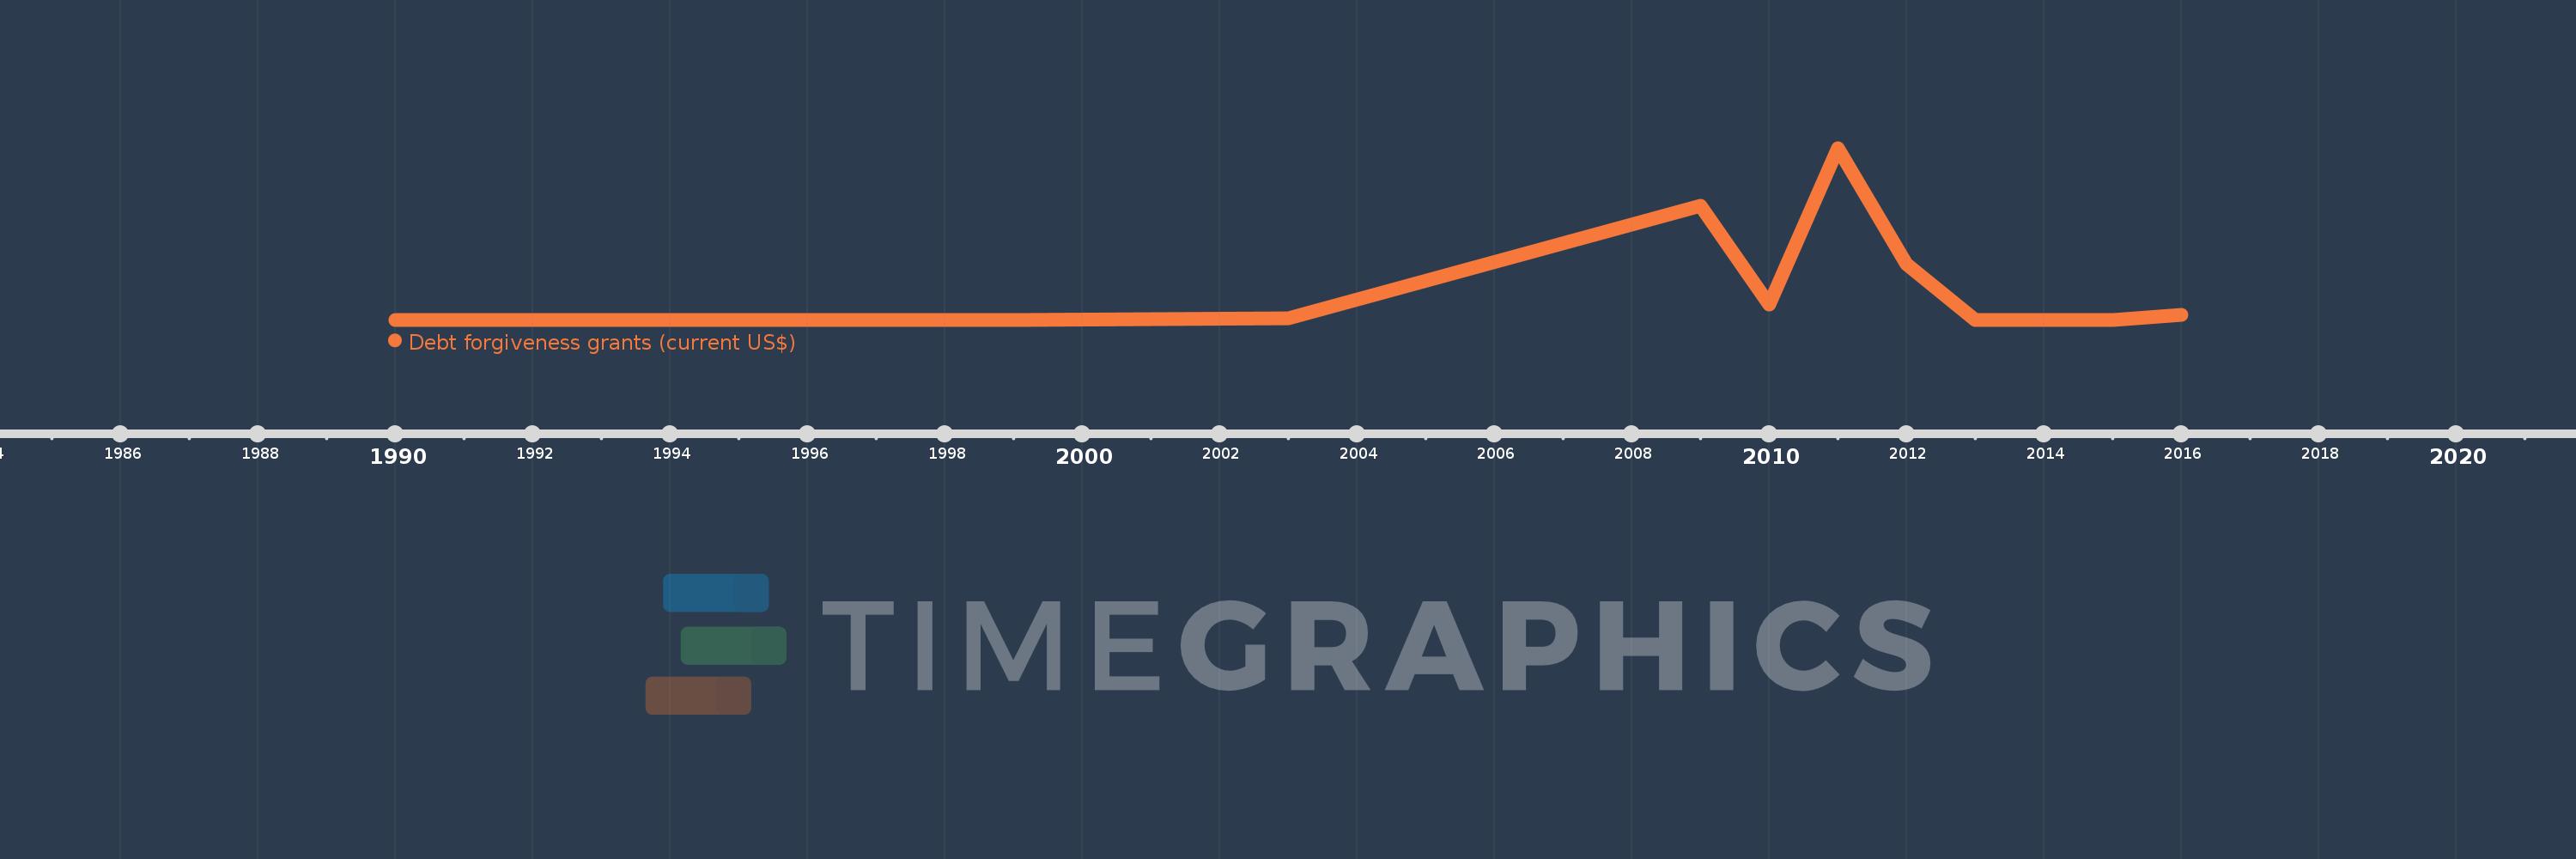
Debt forgiveness grants (current US$)
2016,2015,2014,2013,2012,2011,2010,2009,2003,1999,1997,1996,1995,1994,1993,1992,1991,1990
This statistics in other country:
Timeline:
This timeline shows a graph from 1990 to 2016 of Liberia. No data until 1989. Number of actual observations by date: 18.
Source name:
World Development Indicators
Source organization:
Development Assistance Committee of the Organisation for Economic Co-operation and Development.
Categories, topics:
Aid Effectiveness, External Debt
Last updated:
apr 23, 2017
Indicators value changes by year
Minimum:
170.0K
jan 1, 2013
Maximum:
1.199 bln
jan 1, 2011
At the date of observation
Value
Absolute change
Change from previous value
jan 1, 1990
720.0K
+720.0K
0.0%
jan 1, 1991
840.0K
+120.0K
16.67%
jan 1, 1992
820.0K
-20.0K
-2.38%
jan 1, 1993
870.0K
+50.0K
6.1%
jan 1, 1994
750.0K
-120.0K
-13.79%
jan 1, 1995
560.0K
-190.0K
-25.33%
jan 1, 1996
550.0K
-10.0K
-1.79%
jan 1, 1997
530.0K
-20.0K
-3.64%
jan 1, 1999
470.0K
-60.0K
-11.32%
jan 1, 2003
9.93 mln
+9.46 mln
2.01K%
jan 1, 2009
794.88 mln
+784.95 mln
7.9K%
jan 1, 2010
106.08 mln
-688.8 mln
-86.65%
jan 1, 2011
1.199 bln
+1.093 bln
1.03K%
jan 1, 2012
386.1 mln
-813.27 mln
-67.81%
jan 1, 2013
170.0K
-385.93 mln
-99.96%
jan 1, 2014
170.0K
0.0
0.0%
jan 1, 2015
170.0K
0.0
0.0%
jan 1, 2016
36.31 mln
+36.14 mln
21.26K%
Ranking of countries by current statistics by years


Comments: