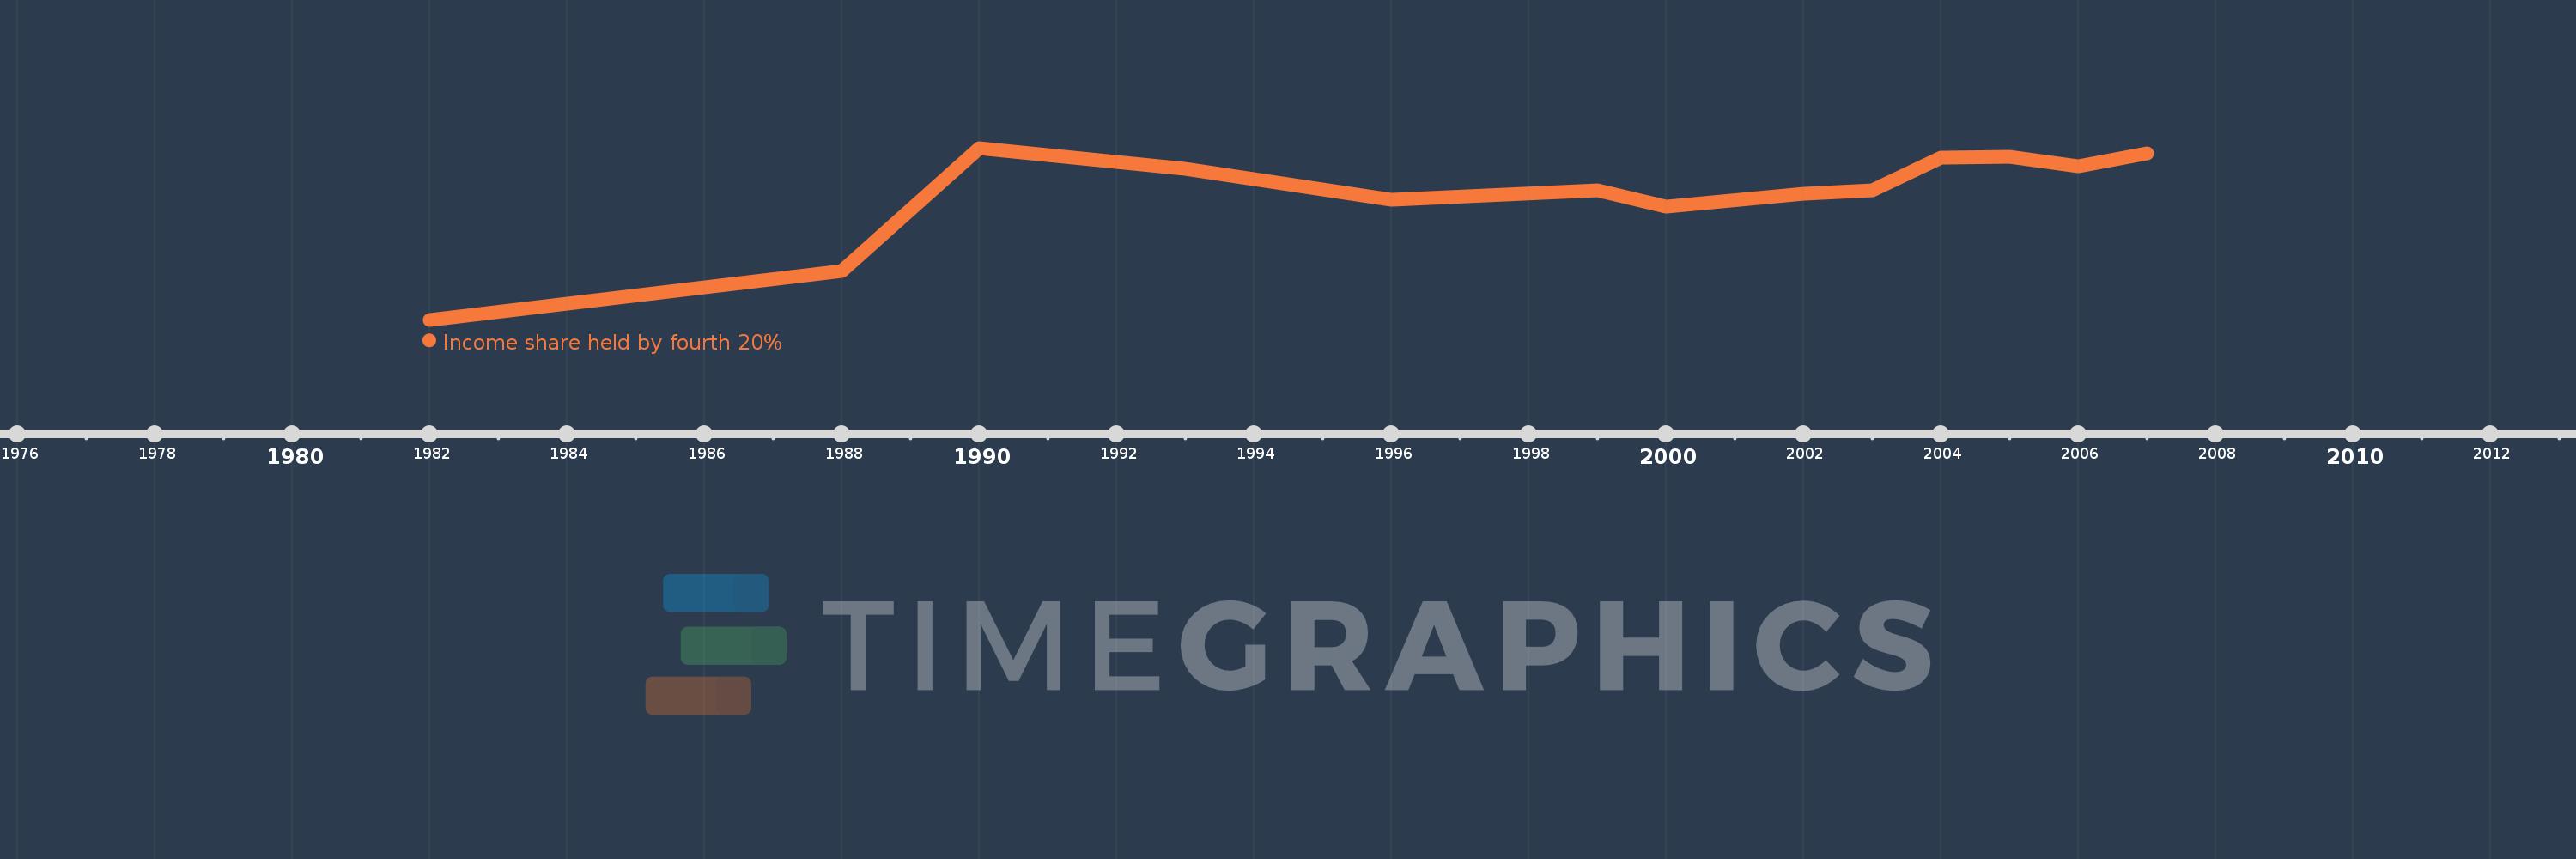
This timeline shows a graph from 1982 to 2007 of Venezuela, RB. No data until 1981. Number of actual observations by date: 13.
Source name:
World Development Indicators
Source organization:
World Bank, Development Research Group. Data are based on primary household survey data obtained from government statistical agencies and World Bank country departments. Data for high-income economies are from the Luxembourg Income Study database. For more information and methodology, please see PovcalNet (http://iresearch.worldbank.org/PovcalNet/index.htm).
Categories, topics:
Poverty
Last updated:
apr 23, 2017
Indicators value changes by year
Meaning:
21.595
Minimum:
19.38
jan 1, 1982
Maximum:
22.41
jan 1, 1990
At the date of observation
Value
Absolute change
Change from the previous value
jan 1, 1982
19.38
+19.38
0.0%
jan 1, 1988
20.24
+0.86
4.44%
jan 1, 1990
22.41
+2.17
10.72%
jan 1, 1993
22.04
-0.37
-1.65%
jan 1, 1996
21.49
-0.55
-2.5%
jan 1, 1999
21.66
+0.17
0.79%
jan 1, 2000
21.37
-0.29
-1.34%
jan 1, 2002
21.6
+0.23
1.08%
jan 1, 2003
21.66
+0.06
0.28%
jan 1, 2004
22.24
+0.58
2.68%
jan 1, 2005
22.25
+0.01
0.04%
jan 1, 2006
22.08
-0.17
-0.76%
jan 1, 2007
22.31
+0.23
1.04%
Ranking of countries by current statistics by years
