29
/
en
AIzaSyAYiBZKx7MnpbEhh9jyipgxe19OcubqV5w
April 1, 2024
216569
Pakistan
PAK
true
2
1
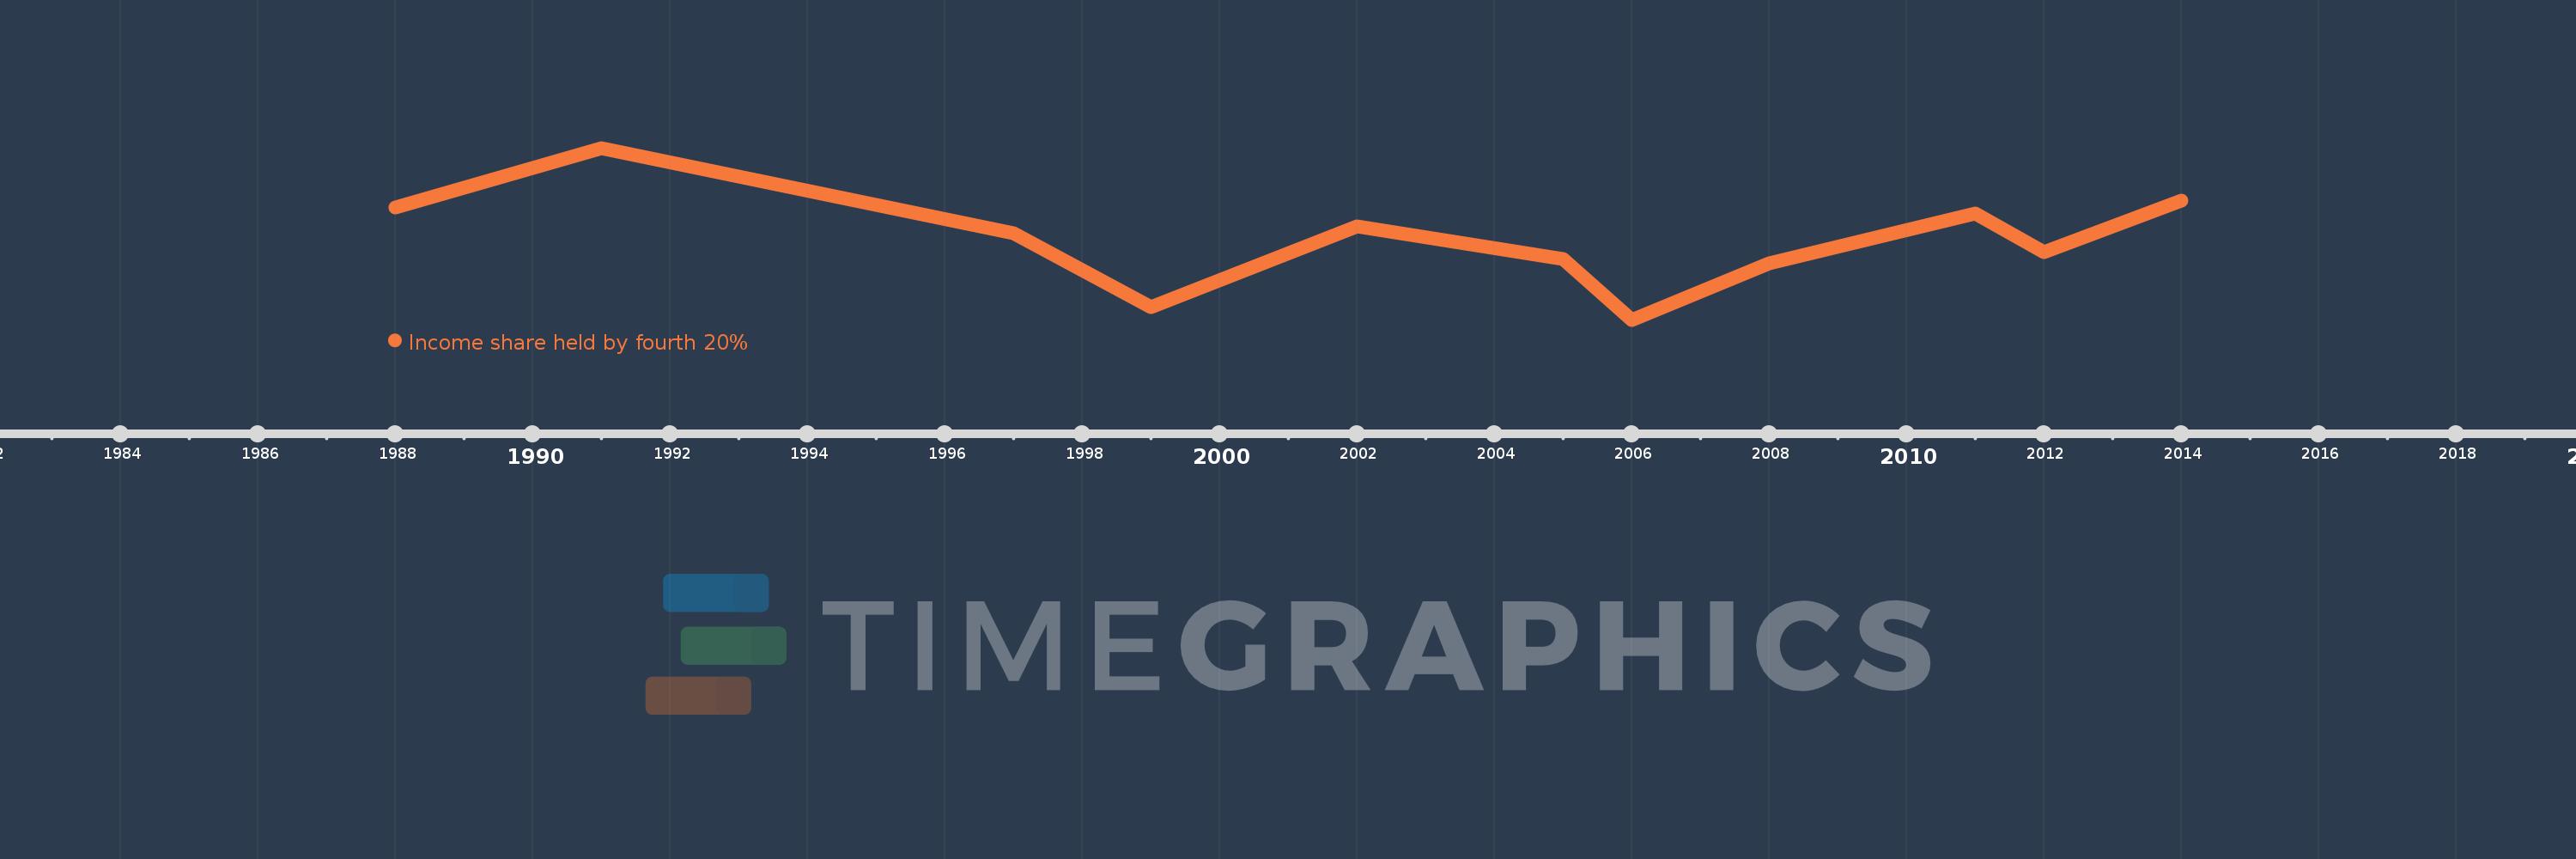
Income share held by fourth 20%
2014,2012,2011,2008,2006,2005,2002,1999,1997,1991,1988
This statistics in other country:
Timeline:
This timeline shows a graph from 1988 to 2014 of Pakistan. No data until 1987. Number of actual observations by date: 11.
Source name:
World Development Indicators
Source organization:
World Bank, Development Research Group. Data are based on primary household survey data obtained from government statistical agencies and World Bank country departments. Data for high-income economies are from the Luxembourg Income Study database. For more information and methodology, please see PovcalNet (http://iresearch.worldbank.org/PovcalNet/index.htm).
Categories, topics:
Poverty
Last updated:
apr 23, 2017
Indicators value changes by year
At the date of observation
Value
Absolute change
Change from previous value
jan 1, 1988
21.23
+21.23
0.0%
jan 1, 1991
21.6
+0.37
1.74%
jan 1, 1997
21.07
-0.53
-2.45%
jan 1, 1999
20.61
-0.46
-2.18%
jan 1, 2002
21.11
+0.5
2.43%
jan 1, 2005
20.91
-0.2
-0.95%
jan 1, 2006
20.53
-0.38
-1.82%
jan 1, 2008
20.88
+0.35
1.7%
jan 1, 2011
21.19
+0.31
1.48%
jan 1, 2012
20.95
-0.24
-1.13%
jan 1, 2014
21.27
+0.32
1.53%
Ranking of countries by current statistics by years


Comments: