29
/
en
AIzaSyAYiBZKx7MnpbEhh9jyipgxe19OcubqV5w
April 1, 2024
276531
United States
USA
true
2
1
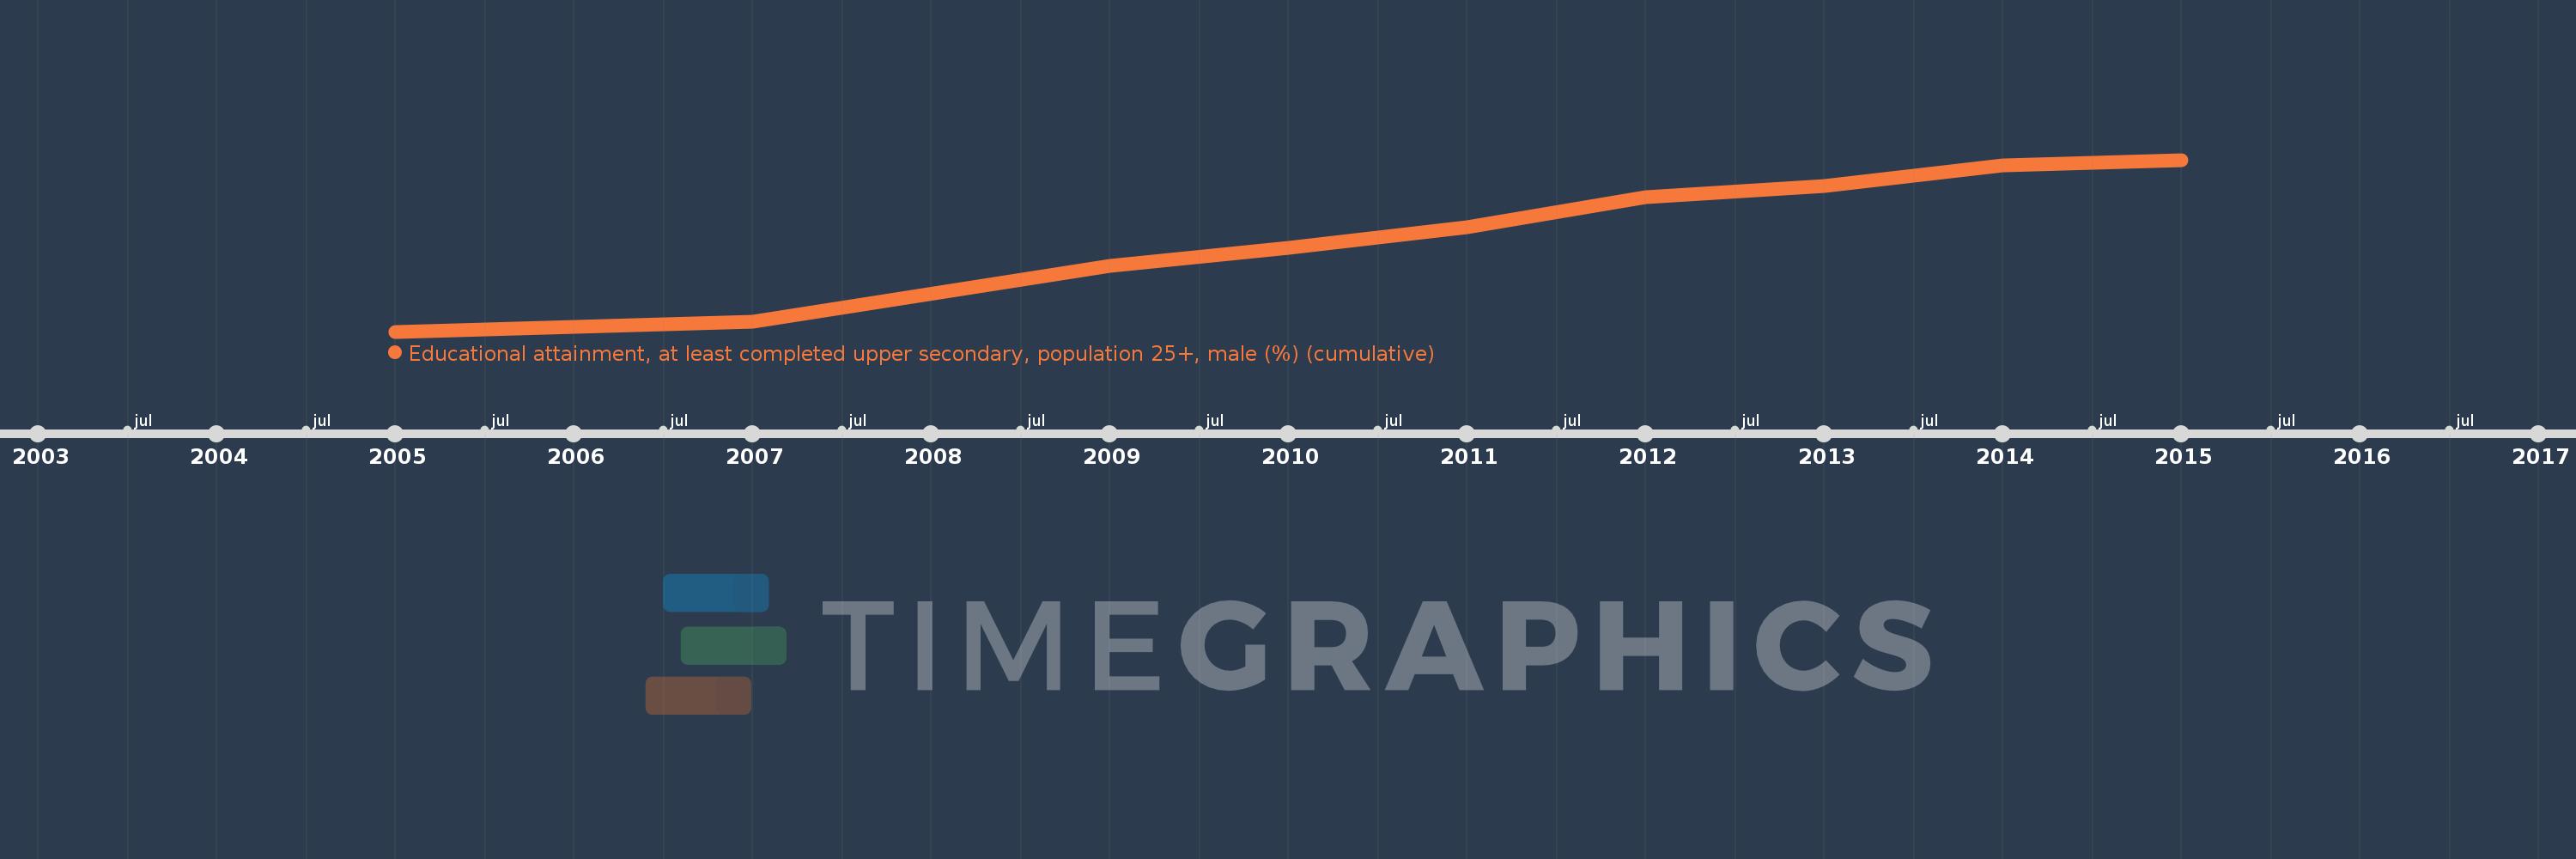
Educational attainment, at least completed upper secondary, population 25+, male (%) (cumulative)
2015,2014,2013,2012,2011,2010,2009,2007,2006,2005
This statistics in other country:
Timeline:
This timeline shows a graph from 2005 to 2015 of United States. No data until 2004. Number of actual observations by date: 10.
Source name:
World Development Indicators
Source organization:
United Nations Educational, Scientific, and Cultural Organization (UNESCO) Institute for Statistics.
Categories, topics:
Education, Gender
Last updated:
apr 23, 2017
Indicators value changes by year
Minimum:
84.848
jan 1, 2005
Maximum:
87.724
jan 1, 2015
At the date of observation
Value
Absolute change
Change from previous value
jan 1, 2005
84.848
+84.848
0.0%
jan 1, 2006
84.927
+0.078
0.09%
jan 1, 2007
85.013
+0.086
0.1%
jan 1, 2009
85.954
+0.941
1.11%
jan 1, 2010
86.253
+0.299
0.35%
jan 1, 2011
86.6
+0.347
0.4%
jan 1, 2012
87.102
+0.502
0.58%
jan 1, 2013
87.291
+0.189
0.22%
jan 1, 2014
87.637
+0.346
0.4%
jan 1, 2015
87.724
+0.087
0.1%
Ranking of countries by current statistics by years


Comments: