30
/
AIzaSyAYiBZKx7MnpbEhh9jyipgxe19OcubqV5w
April 1, 2024
245452
South Africa
ZAF
true
2
1
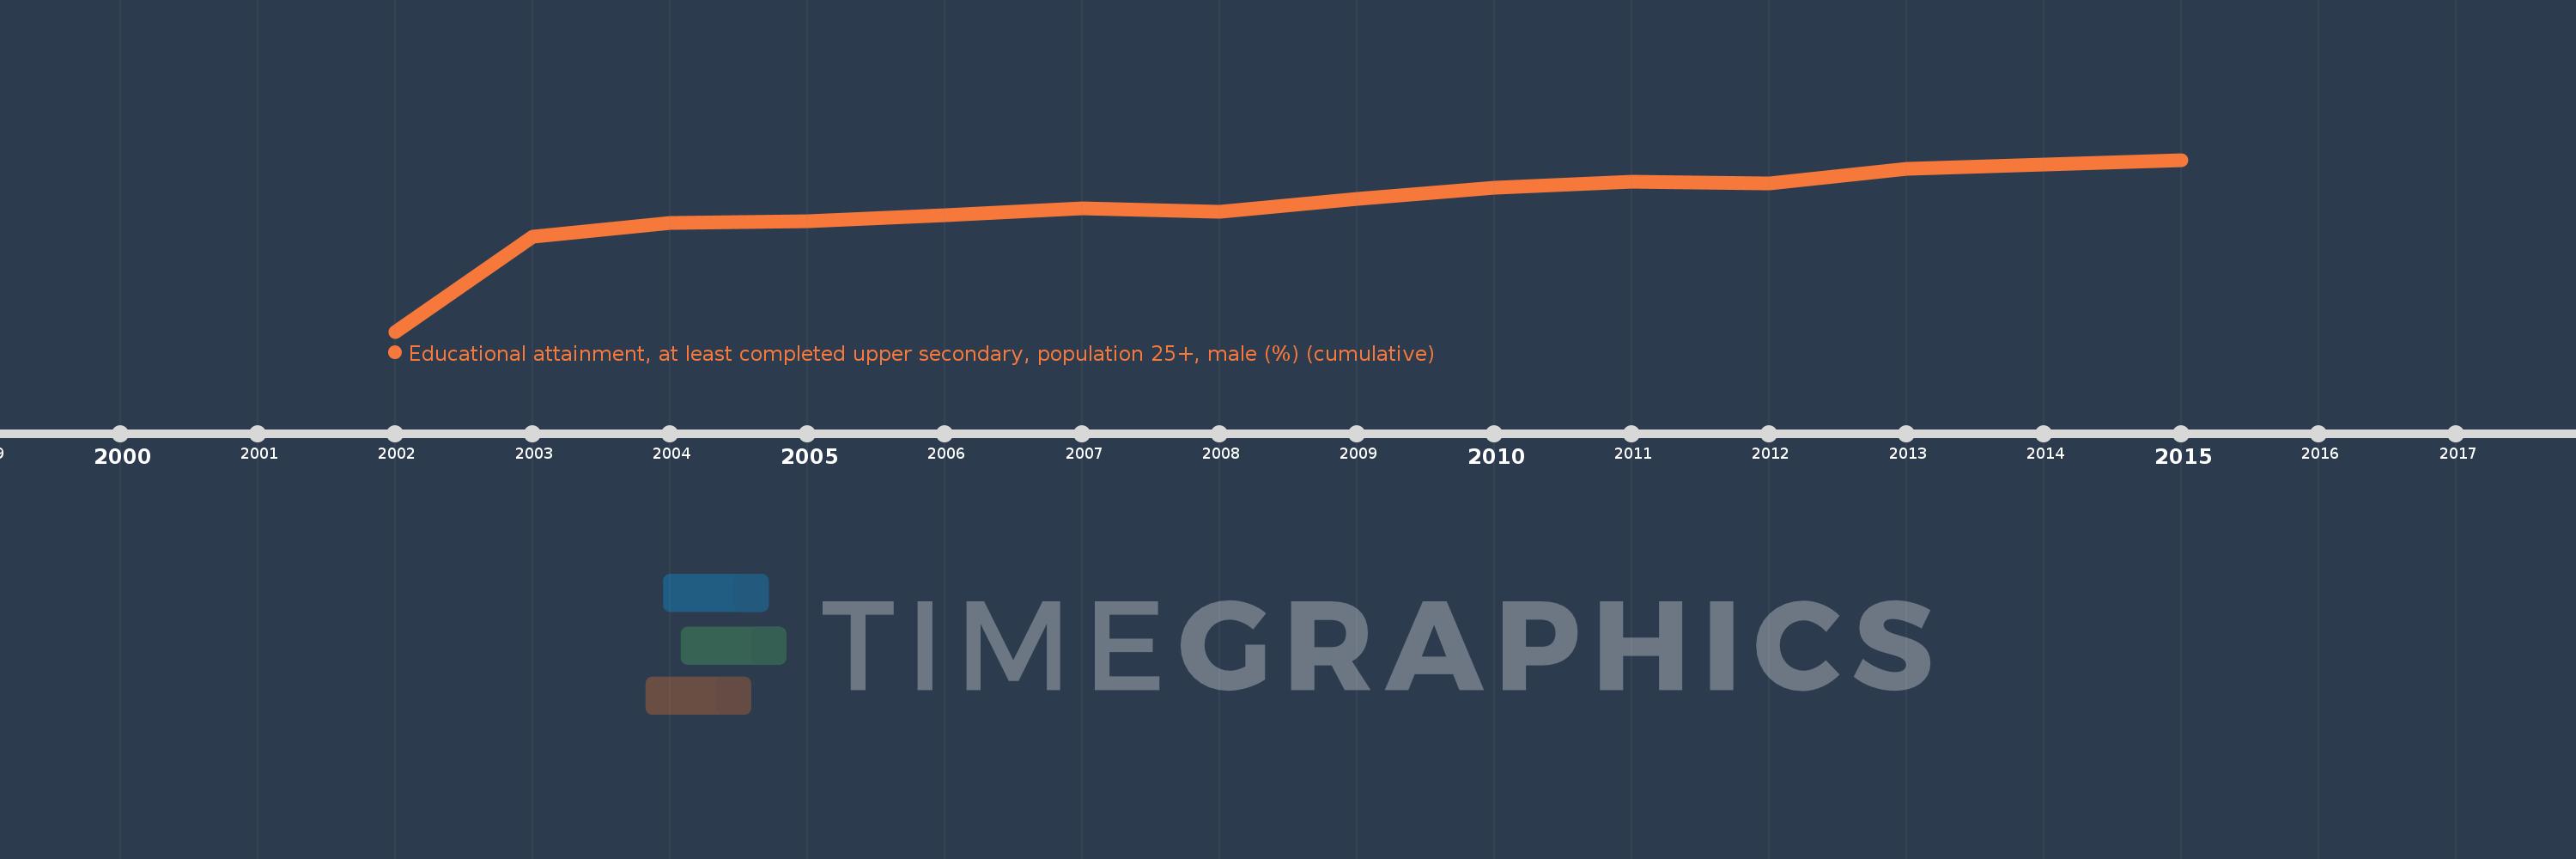
Educational attainment, at least completed upper secondary, population 25+, male (%) (cumulative)
2015,2013,2012,2011,2010,2009,2008,2007,2006,2005,2004,2003,2002
