29
/
en
AIzaSyAYiBZKx7MnpbEhh9jyipgxe19OcubqV5w
April 1, 2024
276375
United States
USA
true
2
1
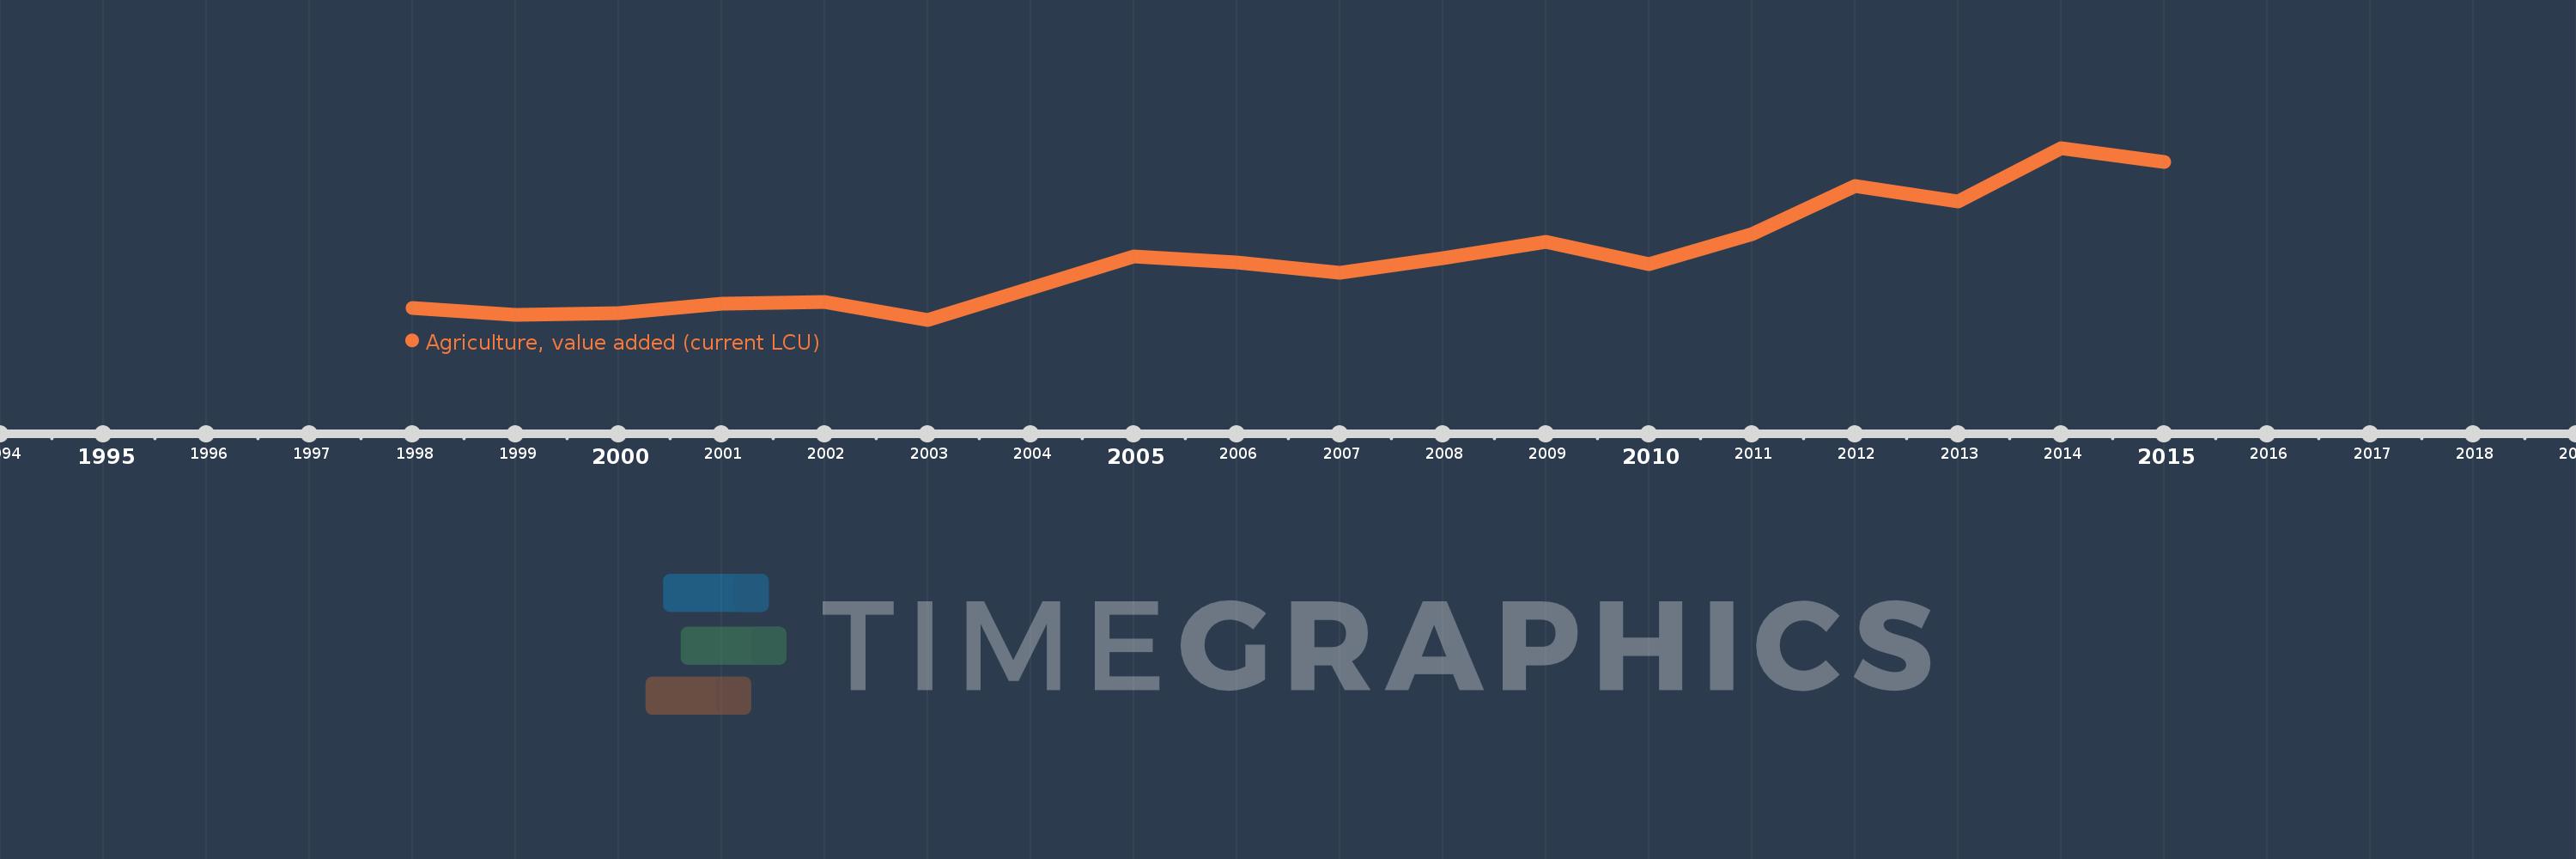
Agriculture, value added (current LCU)
2015,2014,2013,2012,2011,2010,2009,2008,2007,2006,2005,2004,2003,2002,2001,2000,1999,1998
This statistics in other country:
AfghanistanAlbaniaAlgeriaAndorraAngolaAntigua and BarbudaArgentinaArmeniaArubaAustraliaAustriaAzerbaijanBahamas, TheBahrainBangladeshBarbadosBelarusBelgiumBelizeBeninBermudaBhutanBoliviaBosnia and HerzegovinaBotswanaBrazilBrunei DarussalamBulgariaBurkina FasoBurundiCabo VerdeCambodiaCameroonCanadaCayman IslandsCentral African RepublicChadChileChinaColombiaComorosCongo, Dem. Rep.Congo, Rep.Costa RicaCote d'IvoireCroatiaCubaCyprusCzech RepublicDenmarkDjiboutiDominicaDominican RepublicEcuadorEgypt, Arab Rep.El SalvadorEquatorial GuineaEritreaEstoniaEthiopiaFijiFinlandFranceFrench PolynesiaGabonGambia, TheGeorgiaGermanyGhanaGreeceGrenadaGuatemalaGuineaGuinea-BissauGuyanaHondurasHong Kong SAR, ChinaHungaryIcelandIndiaIndonesiaIran, Islamic Rep.IraqIrelandItalyJamaicaJapanJordanKazakhstanKenyaKiribatiKorea, Rep.KosovoKuwaitKyrgyz RepublicLao PDRLatviaLebanonLesothoLiberiaLibyaLithuaniaLuxembourgMacao SAR, ChinaMacedonia, FYRMadagascarMalawiMalaysiaMaldivesMaliMaltaMarshall IslandsMauritaniaMauritiusMexicoMicronesia, Fed. Sts.MoldovaMongoliaMontenegroMoroccoMozambiqueMyanmarNamibiaNepalNetherlandsNew CaledoniaNew ZealandNicaraguaNigerNigeriaNorwayOmanPakistanPalauPanamaPapua New GuineaParaguayPeruPhilippinesPolandPortugalPuerto RicoQatarRomaniaRussian FederationRwandaSamoaSao Tome and PrincipeSaudi ArabiaSenegalSerbiaSeychellesSierra LeoneSingaporeSlovak RepublicSloveniaSolomon IslandsSomaliaSouth AfricaSpainSri LankaSt. Kitts and NevisSt. LuciaSt. Vincent and the GrenadinesSudanSurinameSwazilandSwedenSwitzerlandSyrian Arab RepublicTajikistanTanzaniaThailandTimor-LesteTogoTongaTrinidad and TobagoTunisiaTurkeyTurkmenistanTuvaluUgandaUkraineUnited Arab EmiratesUnited KingdomUnited StatesUruguayUzbekistanVanuatuVenezuela, RBVietnamWest Bank and GazaYemen, Rep.ZambiaZimbabwe Timeline:
This timeline shows a graph from 1998 to 2015 of United States. No data until 1997. Number of actual observations by date: 18.
Source name:
World Development Indicators
Source organization:
World Bank national accounts data, and OECD National Accounts data files.
Categories, topics:
Economy & Growth
Last updated:
apr 23, 2017
Indicators value changes by year
Minimum:
106.4 bln
jan 1, 2003
Maximum:
234.079 bln
jan 1, 2014
At the date of observation
Value
Absolute change
Change from previous value
jan 1, 1998
114.912 bln
+114.912 bln
0.0%
jan 1, 1999
110.289 bln
-4.623 bln
-4.02%
jan 1, 2000
111.175 bln
+886.0 mln
0.8%
jan 1, 2001
118.251 bln
+7.076 bln
6.36%
jan 1, 2002
119.844 bln
+1.593 bln
1.35%
jan 1, 2003
106.4 bln
-13.444 bln
-11.22%
jan 1, 2004
130.076 bln
+23.676 bln
22.25%
jan 1, 2005
153.599 bln
+23.523 bln
18.08%
jan 1, 2006
149.27 bln
-4.329 bln
-2.82%
jan 1, 2007
141.596 bln
-7.674 bln
-5.14%
jan 1, 2008
152.255 bln
+10.659 bln
7.53%
jan 1, 2009
164.224 bln
+11.969 bln
7.86%
jan 1, 2010
147.777 bln
-16.447 bln
-10.01%
jan 1, 2011
170.356 bln
+22.579 bln
15.28%
jan 1, 2012
205.527 bln
+35.171 bln
20.65%
jan 1, 2013
194.255 bln
-11.272 bln
-5.48%
jan 1, 2014
234.079 bln
+39.824 bln
20.5%
jan 1, 2015
223.86 bln
-10.219 bln
-4.37%
Ranking of countries by current statistics by years


Comments: