29
/
en
AIzaSyAYiBZKx7MnpbEhh9jyipgxe19OcubqV5w
April 1, 2024
202541
Mozambique
MOZ
true
2
1
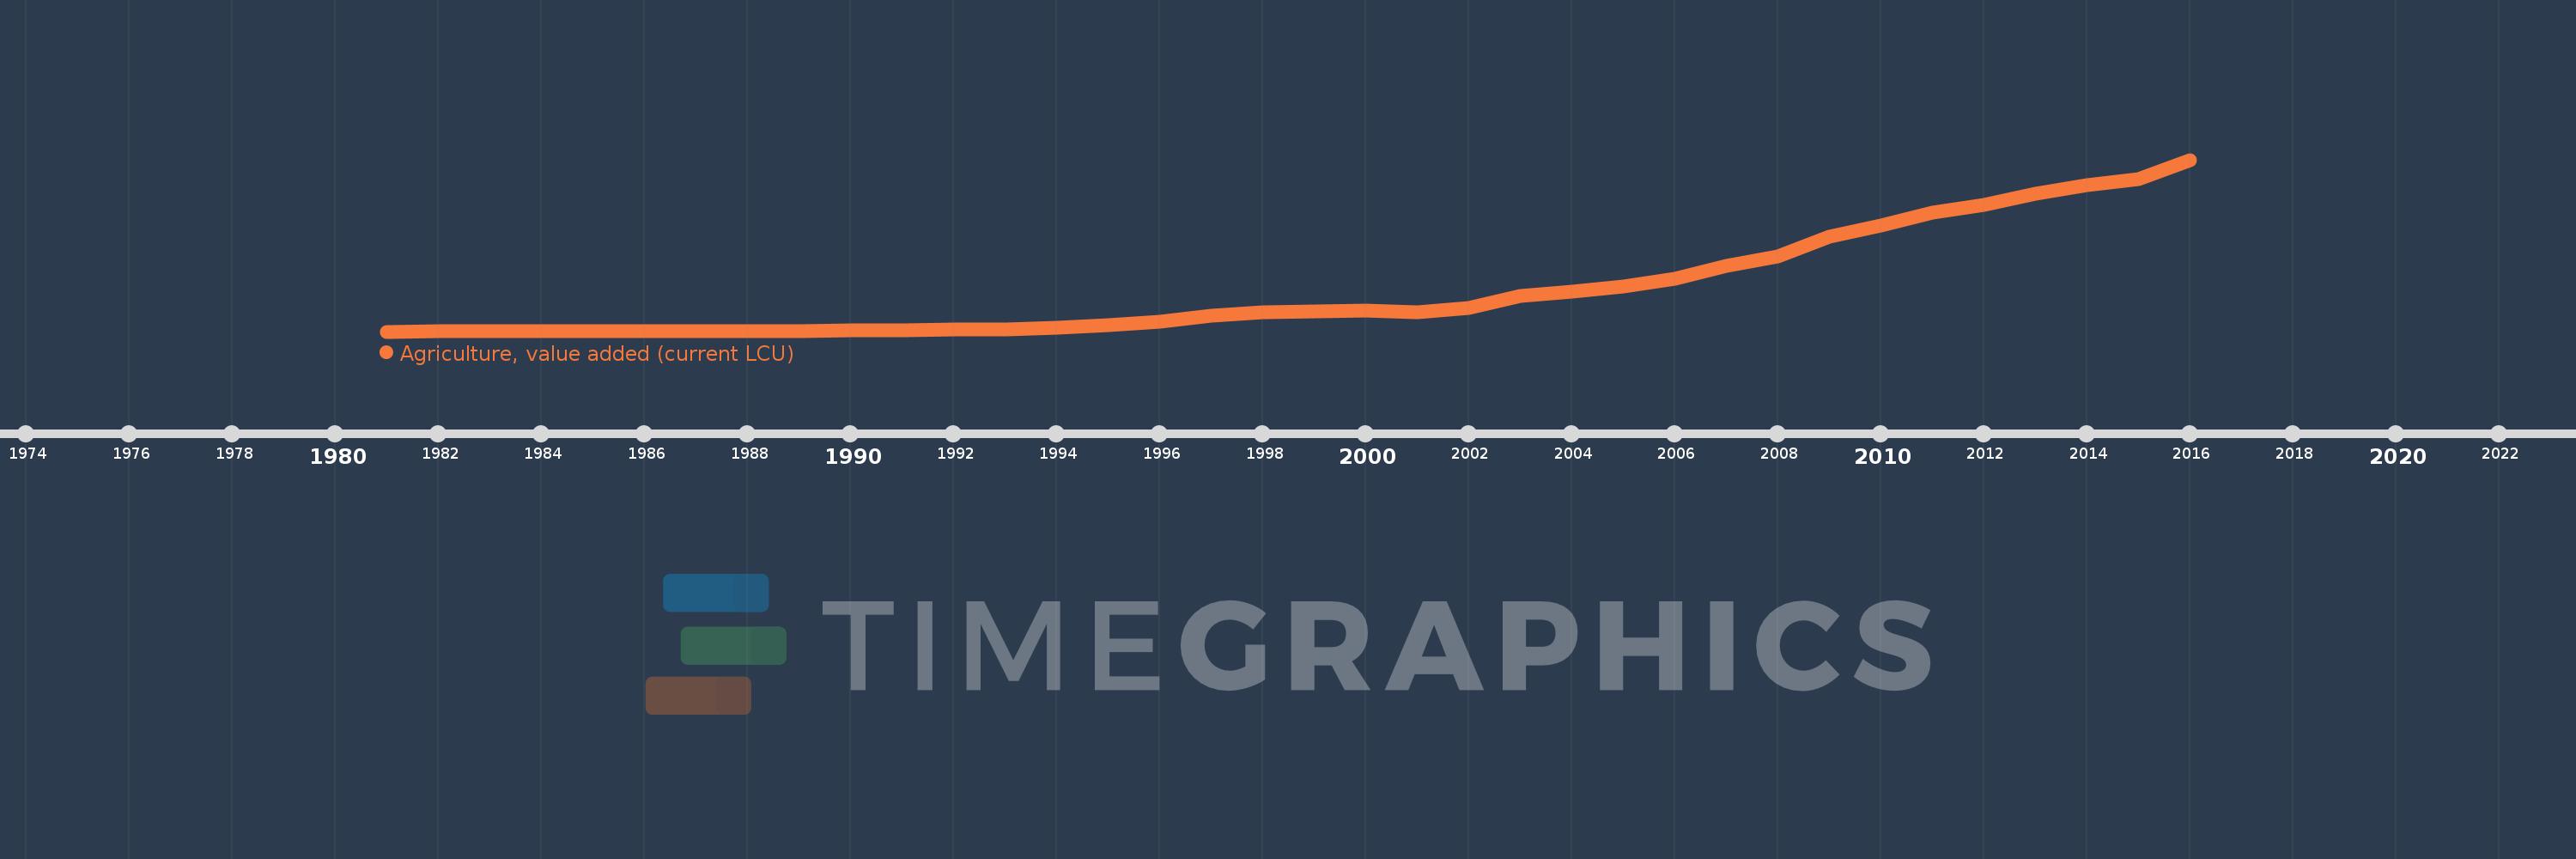
Agriculture, value added (current LCU)
2016,2015,2014,2013,2012,2011,2010,2009,2008,2007,2006,2005,2004,2003,2002,2001,2000,1999,1998,1997,1996,1995,1994,1993,1992,1991,1990,1989,1988,1987,1986,1985,1984,1983,1982,1981
This statistics in other country:
AfghanistanAlbaniaAlgeriaAndorraAngolaAntigua and BarbudaArgentinaArmeniaArubaAustraliaAustriaAzerbaijanBahamas, TheBahrainBangladeshBarbadosBelarusBelgiumBelizeBeninBermudaBhutanBoliviaBosnia and HerzegovinaBotswanaBrazilBrunei DarussalamBulgariaBurkina FasoBurundiCabo VerdeCambodiaCameroonCanadaCayman IslandsCentral African RepublicChadChileChinaColombiaComorosCongo, Dem. Rep.Congo, Rep.Costa RicaCote d'IvoireCroatiaCubaCyprusCzech RepublicDenmarkDjiboutiDominicaDominican RepublicEcuadorEgypt, Arab Rep.El SalvadorEquatorial GuineaEritreaEstoniaEthiopiaFijiFinlandFranceFrench PolynesiaGabonGambia, TheGeorgiaGermanyGhanaGreeceGrenadaGuatemalaGuineaGuinea-BissauGuyanaHondurasHong Kong SAR, ChinaHungaryIcelandIndiaIndonesiaIran, Islamic Rep.IraqIrelandItalyJamaicaJapanJordanKazakhstanKenyaKiribatiKorea, Rep.KosovoKuwaitKyrgyz RepublicLao PDRLatviaLebanonLesothoLiberiaLibyaLithuaniaLuxembourgMacao SAR, ChinaMacedonia, FYRMadagascarMalawiMalaysiaMaldivesMaliMaltaMarshall IslandsMauritaniaMauritiusMexicoMicronesia, Fed. Sts.MoldovaMongoliaMontenegroMoroccoMozambiqueMyanmarNamibiaNepalNetherlandsNew CaledoniaNew ZealandNicaraguaNigerNigeriaNorwayOmanPakistanPalauPanamaPapua New GuineaParaguayPeruPhilippinesPolandPortugalPuerto RicoQatarRomaniaRussian FederationRwandaSamoaSao Tome and PrincipeSaudi ArabiaSenegalSerbiaSeychellesSierra LeoneSingaporeSlovak RepublicSloveniaSolomon IslandsSomaliaSouth AfricaSpainSri LankaSt. Kitts and NevisSt. LuciaSt. Vincent and the GrenadinesSudanSurinameSwazilandSwedenSwitzerlandSyrian Arab RepublicTajikistanTanzaniaThailandTimor-LesteTogoTongaTrinidad and TobagoTunisiaTurkeyTurkmenistanTuvaluUgandaUkraineUnited Arab EmiratesUnited KingdomUnited StatesUruguayUzbekistanVanuatuVenezuela, RBVietnamWest Bank and GazaYemen, Rep.ZambiaZimbabwe Timeline:
This timeline shows a graph from 1981 to 2016 of Mozambique. No data until 1980. Number of actual observations by date: 36.
Source name:
World Development Indicators
Source organization:
World Bank national accounts data, and OECD National Accounts data files.
Categories, topics:
Economy & Growth
Last updated:
apr 23, 2017
Indicators value changes by year
Minimum:
38.733 mln
jan 1, 1981
Maximum:
136.05 bln
jan 1, 2016
At the date of observation
Value
Absolute change
Change from previous value
jan 1, 1981
38.733 mln
+38.733 mln
0.0%
jan 1, 1982
40.34 mln
+1.607 mln
4.15%
jan 1, 1983
43.277 mln
+2.937 mln
7.28%
jan 1, 1984
46.213 mln
+2.936 mln
6.78%
jan 1, 1985
41.545 mln
-4.668 mln
-10.1%
jan 1, 1986
91.666 mln
+50.121 mln
120.64%
jan 1, 1987
88.63 mln
-3.036 mln
-3.31%
jan 1, 1988
289.684 mln
+201.054 mln
226.85%
jan 1, 1989
444.213 mln
+154.529 mln
53.34%
jan 1, 1990
753.151 mln
+308.938 mln
69.55%
jan 1, 1991
795.967 mln
+42.815 mln
5.68%
jan 1, 1992
1.693 bln
+896.846 mln
112.67%
jan 1, 1993
1.853 bln
+160.119 mln
9.46%
jan 1, 1994
3.329 bln
+1.476 bln
79.68%
jan 1, 1995
4.849 bln
+1.519 bln
45.63%
jan 1, 1996
7.634 bln
+2.785 bln
57.44%
jan 1, 1997
12.675 bln
+5.041 bln
66.04%
jan 1, 1998
15.328 bln
+2.653 bln
20.93%
jan 1, 1999
16.097 bln
+769.629 mln
5.02%
jan 1, 2000
16.454 bln
+356.931 mln
2.22%
jan 1, 2001
15.365 bln
-1.089 bln
-6.62%
jan 1, 2002
18.922 bln
+3.557 bln
23.15%
jan 1, 2003
28.572 bln
+9.651 bln
51.01%
jan 1, 2004
31.705 bln
+3.133 bln
10.96%
jan 1, 2005
35.94 bln
+4.235 bln
13.36%
jan 1, 2006
41.785 bln
+5.845 bln
16.26%
jan 1, 2007
51.859 bln
+10.074 bln
24.11%
jan 1, 2008
59.705 bln
+7.846 bln
15.13%
jan 1, 2009
75.018 bln
+15.313 bln
25.65%
jan 1, 2010
83.779 bln
+8.761 bln
11.68%
jan 1, 2011
94.292 bln
+10.514 bln
12.55%
jan 1, 2012
100.369 bln
+6.077 bln
6.44%
jan 1, 2013
109.287 bln
+8.918 bln
8.89%
jan 1, 2014
116.129 bln
+6.841 bln
6.26%
jan 1, 2015
120.982 bln
+4.853 bln
4.18%
jan 1, 2016
136.05 bln
+15.069 bln
12.46%
Ranking of countries by current statistics by years


Comments: