29
/
en
AIzaSyAYiBZKx7MnpbEhh9jyipgxe19OcubqV5w
April 1, 2024
27627
East Asia & Pacific
EAS
false
2
1
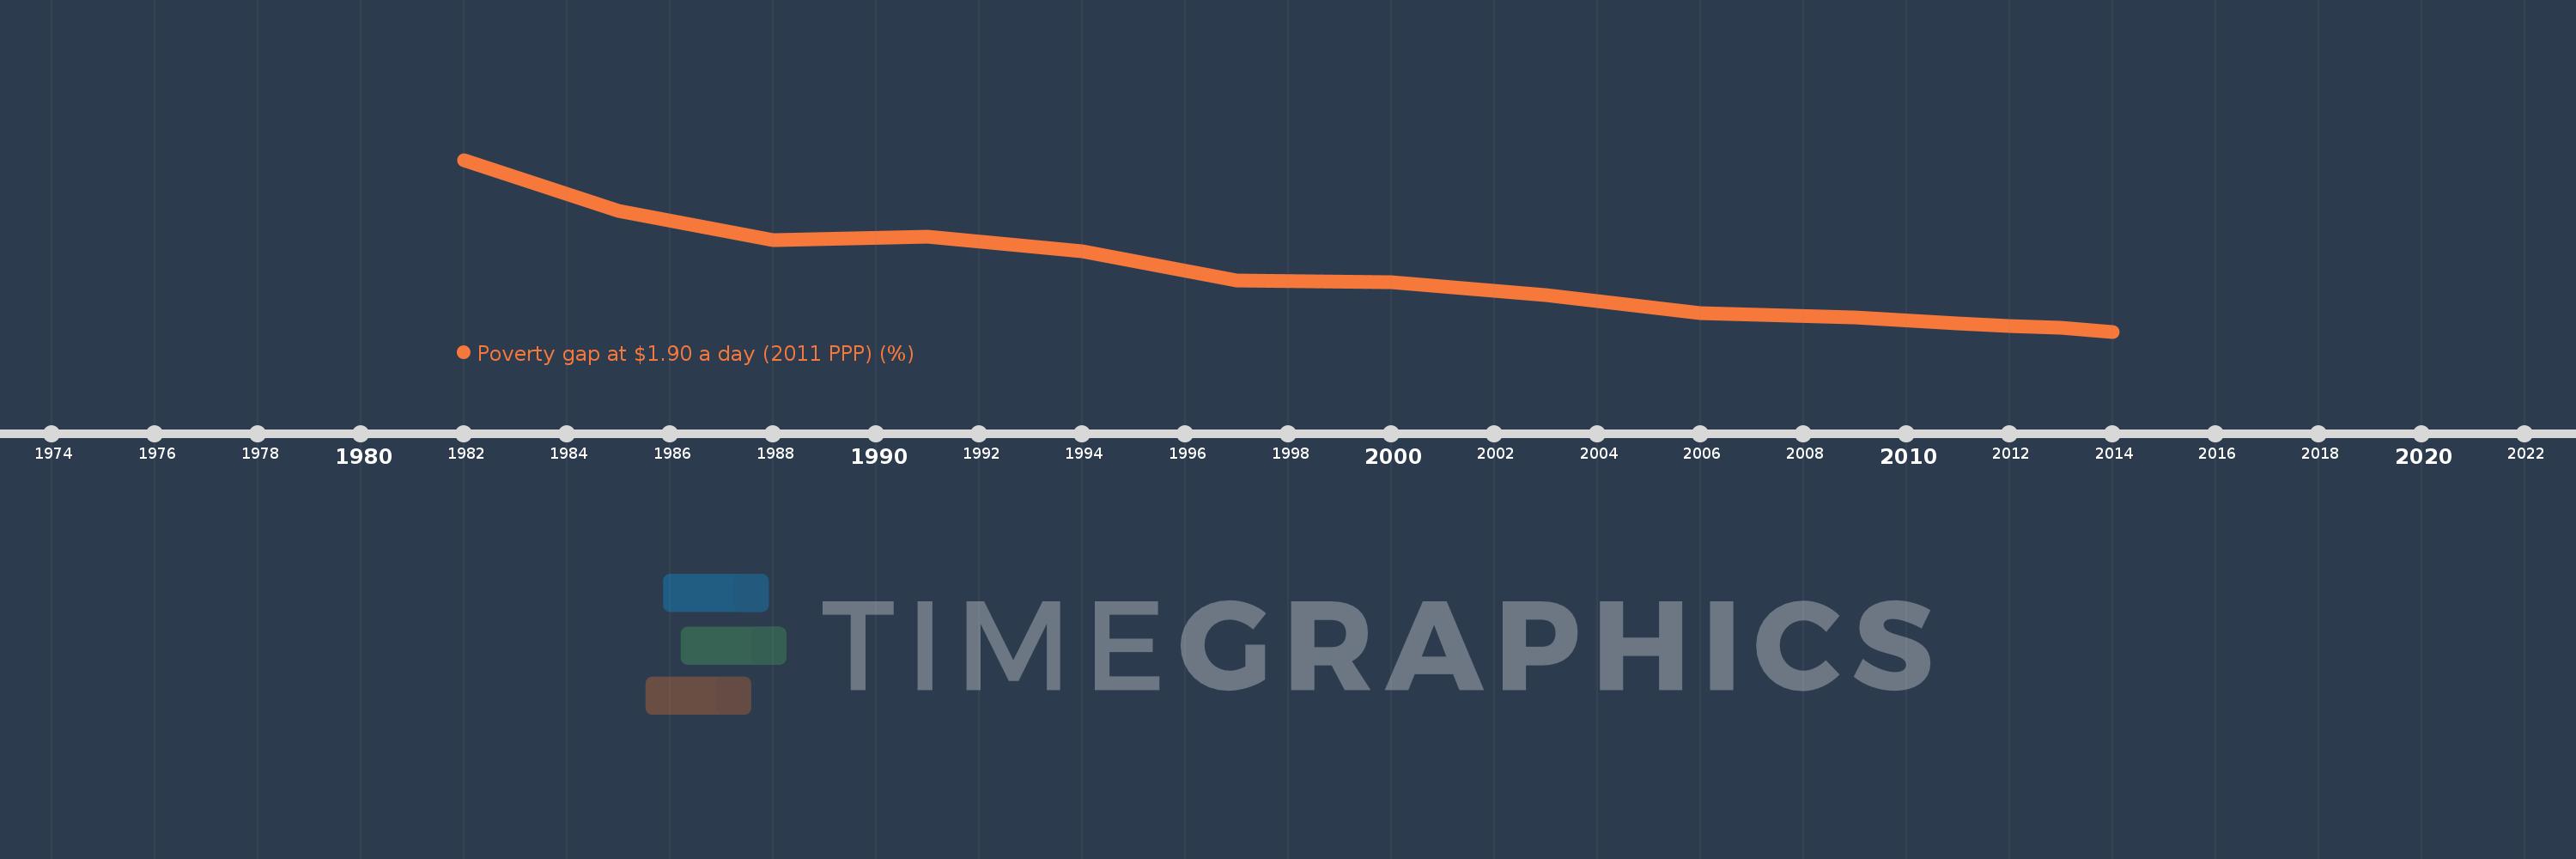
Poverty gap at $1.90 a day (2011 PPP) (%)
2014,2013,2012,2011,2009,2006,2003,2000,1997,1994,1991,1988,1985,1982
This statistics in other country:
Timeline:
This timeline shows a graph from 1982 to 2014 of East Asia & Pacific. No data until 1981. Number of actual observations by date: 14.
Source name:
World Development Indicators
Source organization:
World Bank, Development Research Group. Data are based on primary household survey data obtained from government statistical agencies and World Bank country departments. Data for high-income economies are from the Luxembourg Income Study database. For more information and methodology, please see PovcalNet (http://iresearch.worldbank.org/PovcalNet/index.htm).
Categories, topics:
Poverty
Last updated:
apr 23, 2017
Indicators value changes by year
At the date of observation
Value
Absolute change
Change from previous value
jan 1, 1982
38.23
+38.23
0.0%
jan 1, 1985
26.99
-11.24
-29.4%
jan 1, 1988
20.72
-6.27
-23.23%
jan 1, 1991
21.37
+0.65
3.14%
jan 1, 1994
18.21
-3.16
-14.79%
jan 1, 1997
11.85
-6.36
-34.93%
jan 1, 2000
11.52
-0.33
-2.78%
jan 1, 2003
8.73
-2.79
-24.22%
jan 1, 2006
4.68
-4.05
-46.39%
jan 1, 2009
3.73
-0.95
-20.3%
jan 1, 2011
2.52
-1.21
-32.44%
jan 1, 2012
1.81
-0.71
-28.17%
jan 1, 2013
1.45
-0.36
-19.89%
jan 1, 2014
0.66
-0.79
-54.48%
Ranking of countries by current statistics by years


Comments: