29
/
en
AIzaSyAYiBZKx7MnpbEhh9jyipgxe19OcubqV5w
April 1, 2024
185701
Madagascar
MDG
true
2
1
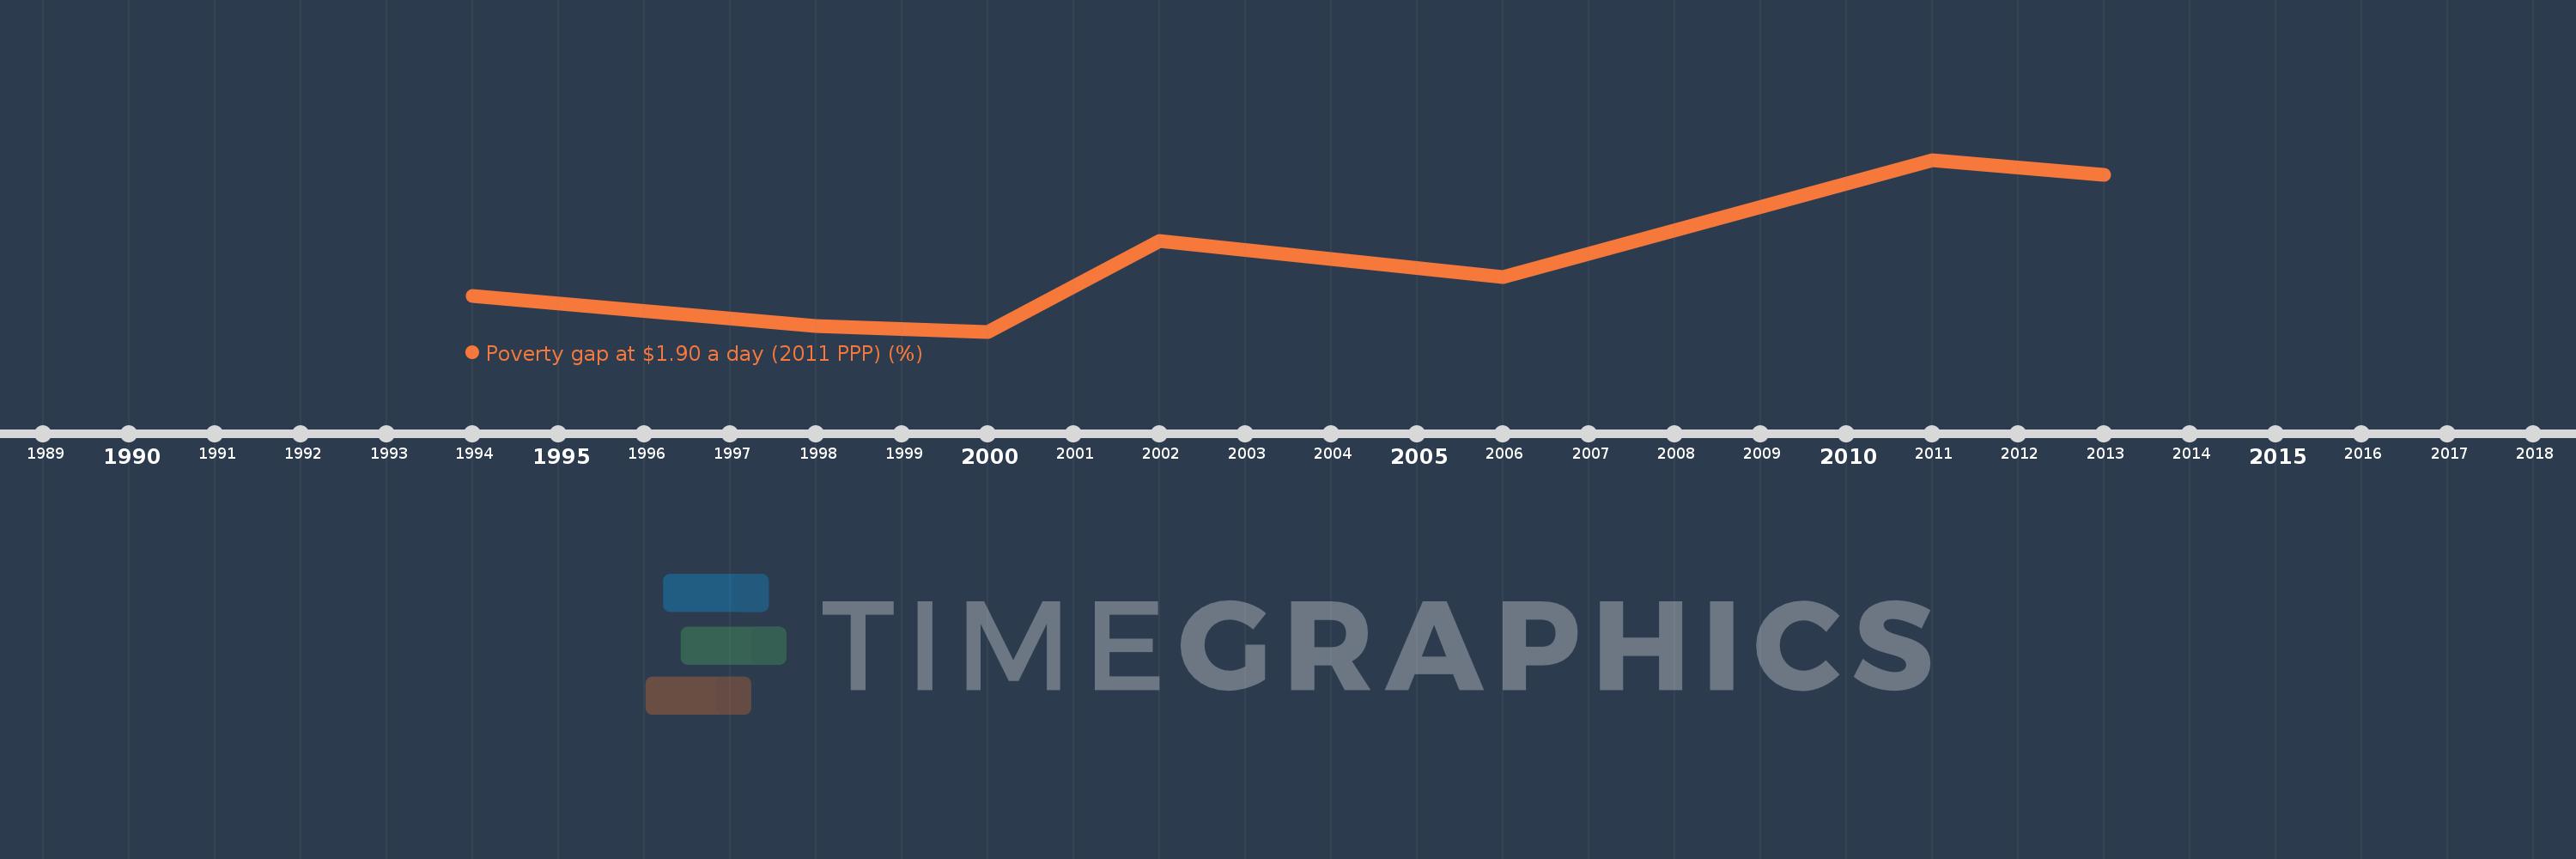
Poverty gap at $1.90 a day (2011 PPP) (%)
2013,2011,2006,2002,2000,1998,1994
This statistics in other country:
Timeline:
This timeline shows a graph from 1994 to 2013 of Madagascar. No data until 1993. Number of actual observations by date: 7.
Source name:
World Development Indicators
Source organization:
World Bank, Development Research Group. Data are based on primary household survey data obtained from government statistical agencies and World Bank country departments. Data for high-income economies are from the Luxembourg Income Study database. For more information and methodology, please see PovcalNet (http://iresearch.worldbank.org/PovcalNet/index.htm).
Categories, topics:
Poverty
Last updated:
apr 23, 2017
Indicators value changes by year
At the date of observation
Value
Absolute change
Change from previous value
jan 1, 1994
30.35
+30.35
0.0%
jan 1, 1998
28.12
-2.23
-7.35%
jan 1, 2000
27.71
-0.41
-1.46%
jan 1, 2002
34.36
+6.65
24.0%
jan 1, 2006
31.7
-2.66
-7.74%
jan 1, 2011
40.32
+8.62
27.19%
jan 1, 2013
39.23
-1.09
-2.7%
Ranking of countries by current statistics by years


Comments: