29
/
en
AIzaSyAYiBZKx7MnpbEhh9jyipgxe19OcubqV5w
April 1, 2024
275106
United Arab Emirates
ARE
true
2
1
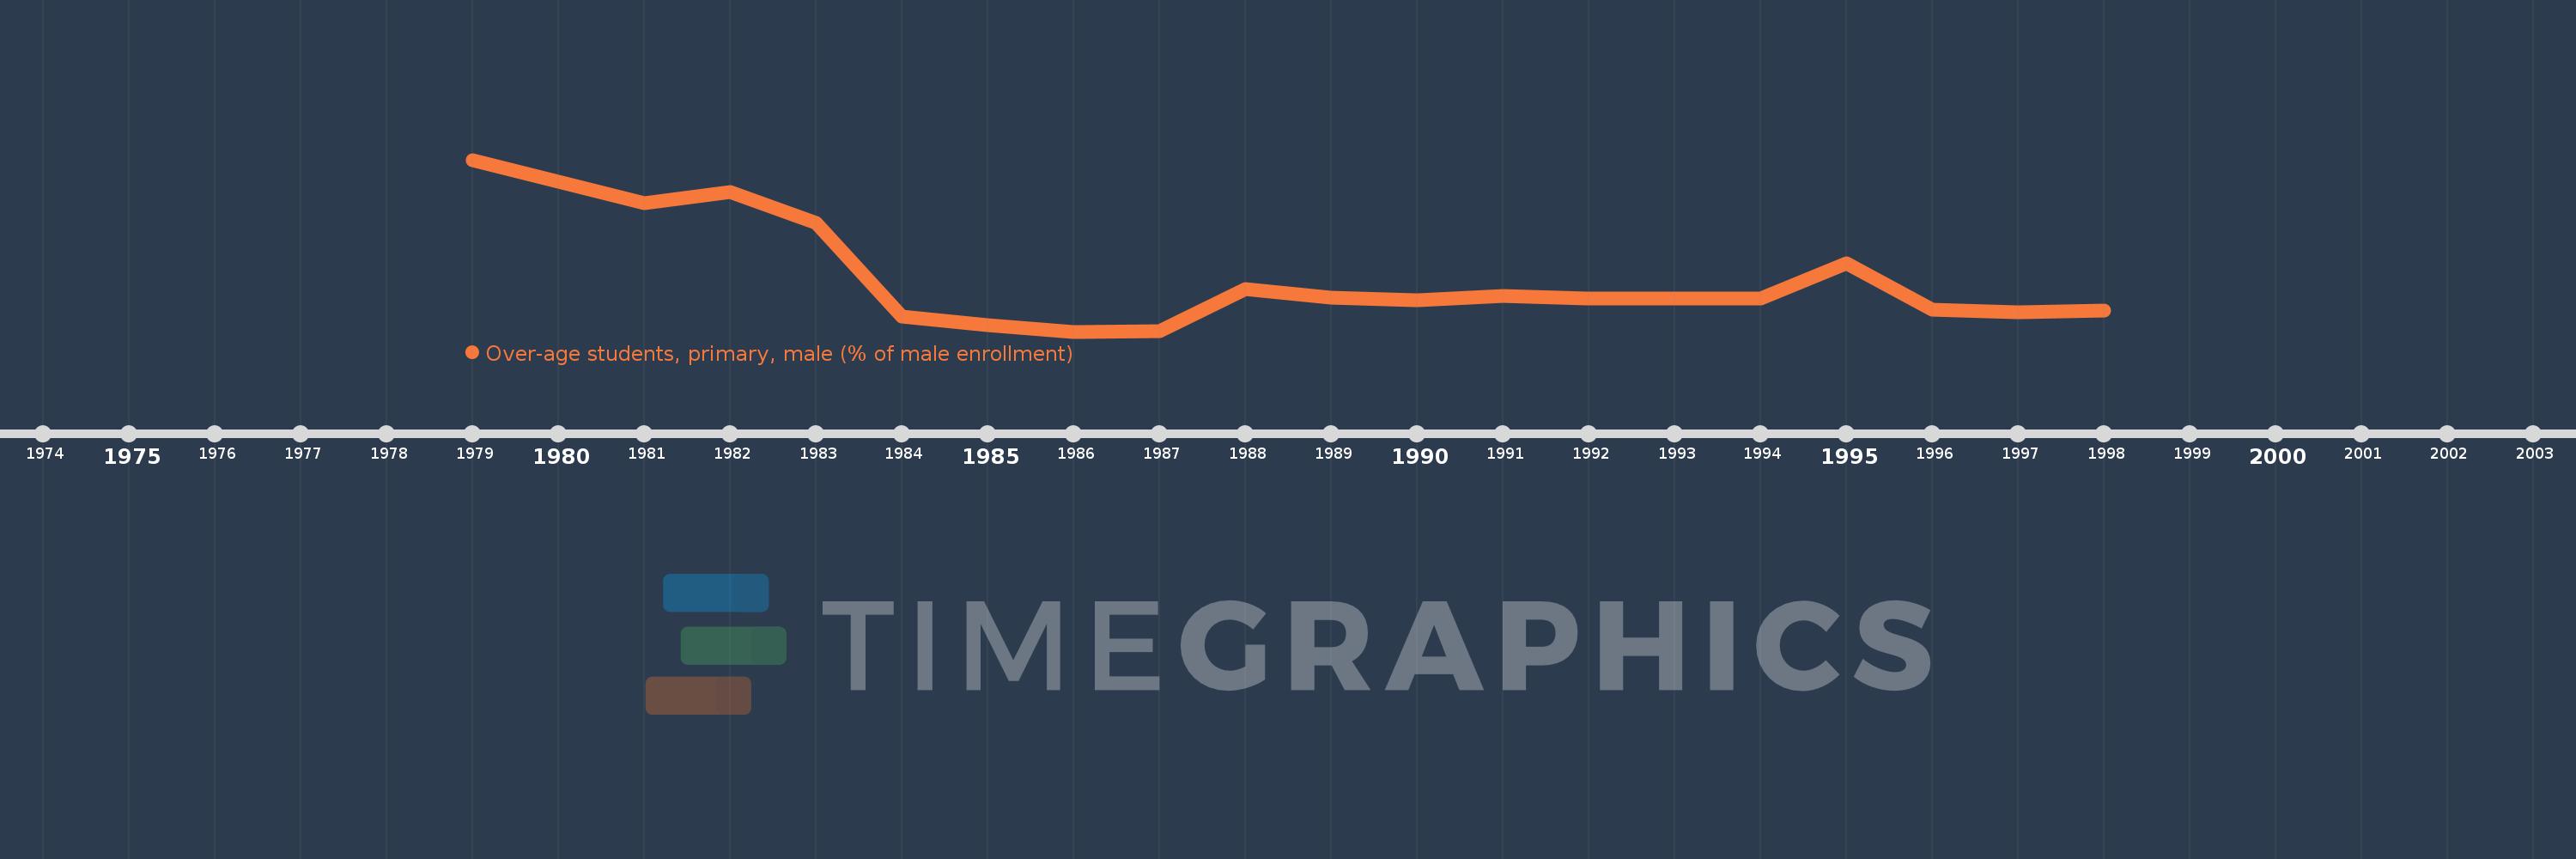
Over-age students, primary, male (% of male enrollment)
1998,1997,1996,1995,1994,1993,1992,1991,1990,1989,1988,1987,1986,1985,1984,1983,1982,1981,1979
This statistics in other country:
AfghanistanAlbaniaAlgeriaAndorraAngolaAntigua and BarbudaArgentinaArubaAustraliaAustriaAzerbaijanBahamas, TheBahrainBangladeshBarbadosBelarusBelgiumBelizeBeninBermudaBhutanBoliviaBosnia and HerzegovinaBotswanaBritish Virgin IslandsBrunei DarussalamBulgariaBurkina FasoBurundiCabo VerdeCambodiaCameroonCanadaCentral African RepublicChadChileChinaColombiaComorosCongo, Dem. Rep.Congo, Rep.Costa RicaCote d'IvoireCubaCyprusDenmarkDjiboutiDominicaDominican RepublicEcuadorEgypt, Arab Rep.El SalvadorEquatorial GuineaEritreaEstoniaEthiopiaFijiFinlandFranceGabonGambia, TheGeorgiaGermanyGhanaGreeceGrenadaGuatemalaGuineaGuinea-BissauGuyanaHaitiHondurasHong Kong SAR, ChinaHungaryIcelandIndiaIndonesiaIran, Islamic Rep.IraqIrelandItalyJamaicaJapanJordanKazakhstanKenyaKiribatiKorea, Dem. People’s Rep.Korea, Rep.KuwaitKyrgyz RepublicLao PDRLebanonLesothoLibyaLuxembourgMacao SAR, ChinaMadagascarMalawiMalaysiaMaldivesMaliMaltaMarshall IslandsMauritaniaMauritiusMexicoMoldovaMongoliaMontenegroMoroccoMozambiqueMyanmarNamibiaNepalNetherlandsNew ZealandNicaraguaNigerNorwayOmanPakistanPalauPanamaParaguayPeruPhilippinesPolandPortugalPuerto RicoQatarRussian FederationRwandaSamoaSao Tome and PrincipeSaudi ArabiaSenegalSerbiaSeychellesSierra LeoneSingaporeSint Maarten (Dutch part)SloveniaSolomon IslandsSomaliaSouth AfricaSouth SudanSpainSri LankaSt. Kitts and NevisSt. LuciaSt. Vincent and the GrenadinesSurinameSwazilandSwedenSwitzerlandSyrian Arab RepublicTajikistanTanzaniaThailandTimor-LesteTogoTongaTrinidad and TobagoTunisiaTurkeyTurks and Caicos IslandsTuvaluUgandaUkraineUnited Arab EmiratesUnited KingdomUnited StatesUruguayVanuatuVenezuela, RBVietnamZambiaZimbabwe Timeline:
This timeline shows a graph from 1979 to 1998 of United Arab Emirates. No data until 1978. Number of actual observations by date: 19.
Source name:
World Development Indicators
Source organization:
United Nations Educational, Scientific, and Cultural Organization (UNESCO) Institute for Statistics.
Categories, topics:
Education
Last updated:
apr 23, 2017
Indicators value changes by year
Maximum:
17.485
jan 1, 1979
At the date of observation
Value
Absolute change
Change from previous value
jan 1, 1979
17.485
+17.485
0.0%
jan 1, 1981
14.225
-3.26
-18.64%
jan 1, 1982
15.075
+0.85
5.97%
jan 1, 1983
12.72
-2.355
-15.62%
jan 1, 1984
5.667
-7.053
-55.45%
jan 1, 1985
4.975
-0.693
-12.22%
jan 1, 1986
4.509
-0.465
-9.36%
jan 1, 1987
4.54
+0.03
0.68%
jan 1, 1988
7.749
+3.209
70.7%
jan 1, 1989
7.062
-0.687
-8.87%
jan 1, 1990
6.897
-0.165
-2.33%
jan 1, 1991
7.173
+0.275
3.99%
jan 1, 1992
6.999
-0.174
-2.42%
jan 1, 1993
6.993
-0.006
-0.08%
jan 1, 1994
7.039
+0.046
0.65%
jan 1, 1995
9.637
+2.599
36.92%
jan 1, 1996
6.153
-3.484
-36.15%
jan 1, 1997
5.999
-0.154
-2.5%
jan 1, 1998
6.075
+0.075
1.26%
Ranking of countries by current statistics by years


Comments: