30
/
AIzaSyAYiBZKx7MnpbEhh9jyipgxe19OcubqV5w
April 1, 2024
116128
Cuba
CUB
true
2
1
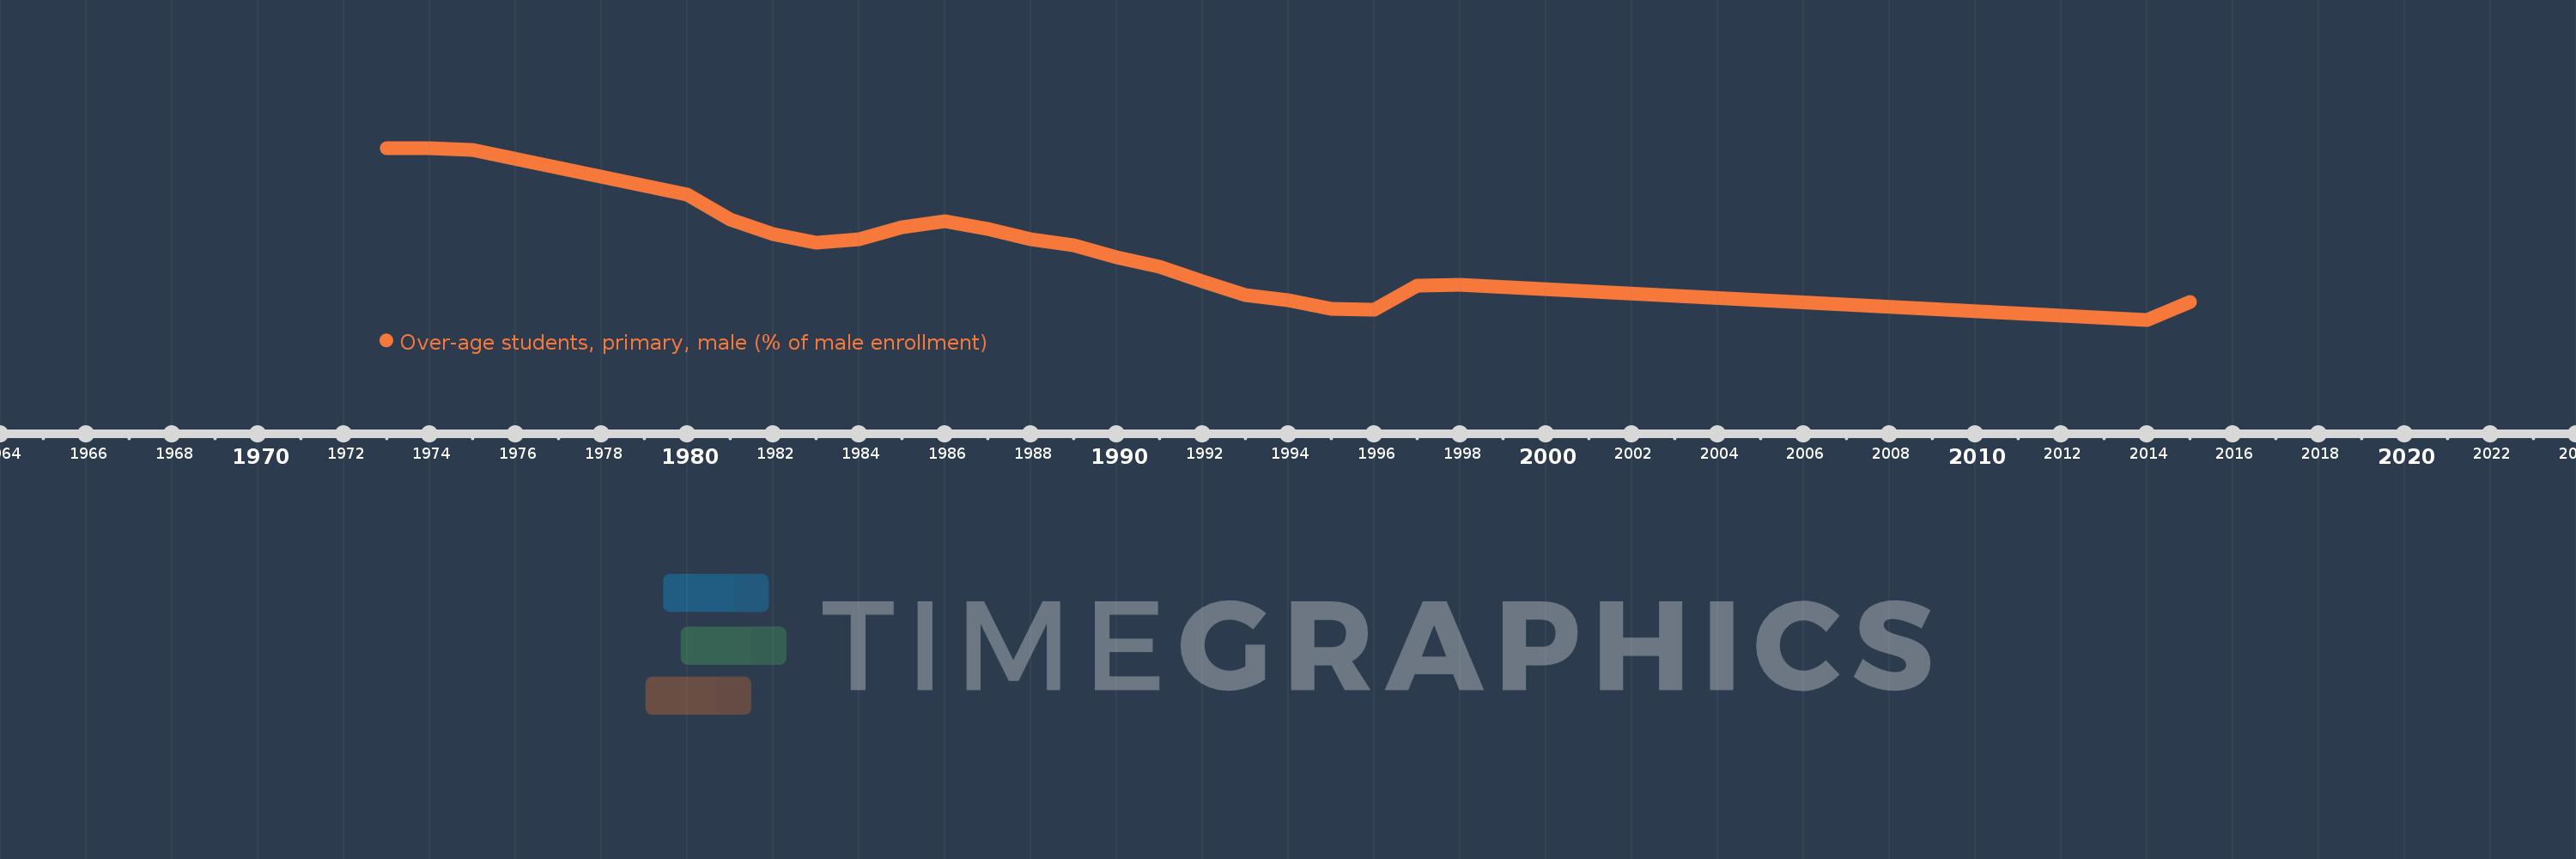
Over-age students, primary, male (% of male enrollment)
2015,2014,1998,1997,1996,1995,1994,1993,1992,1991,1990,1989,1988,1987,1986,1985,1984,1983,1982,1981,1980,1975,1974,1973
