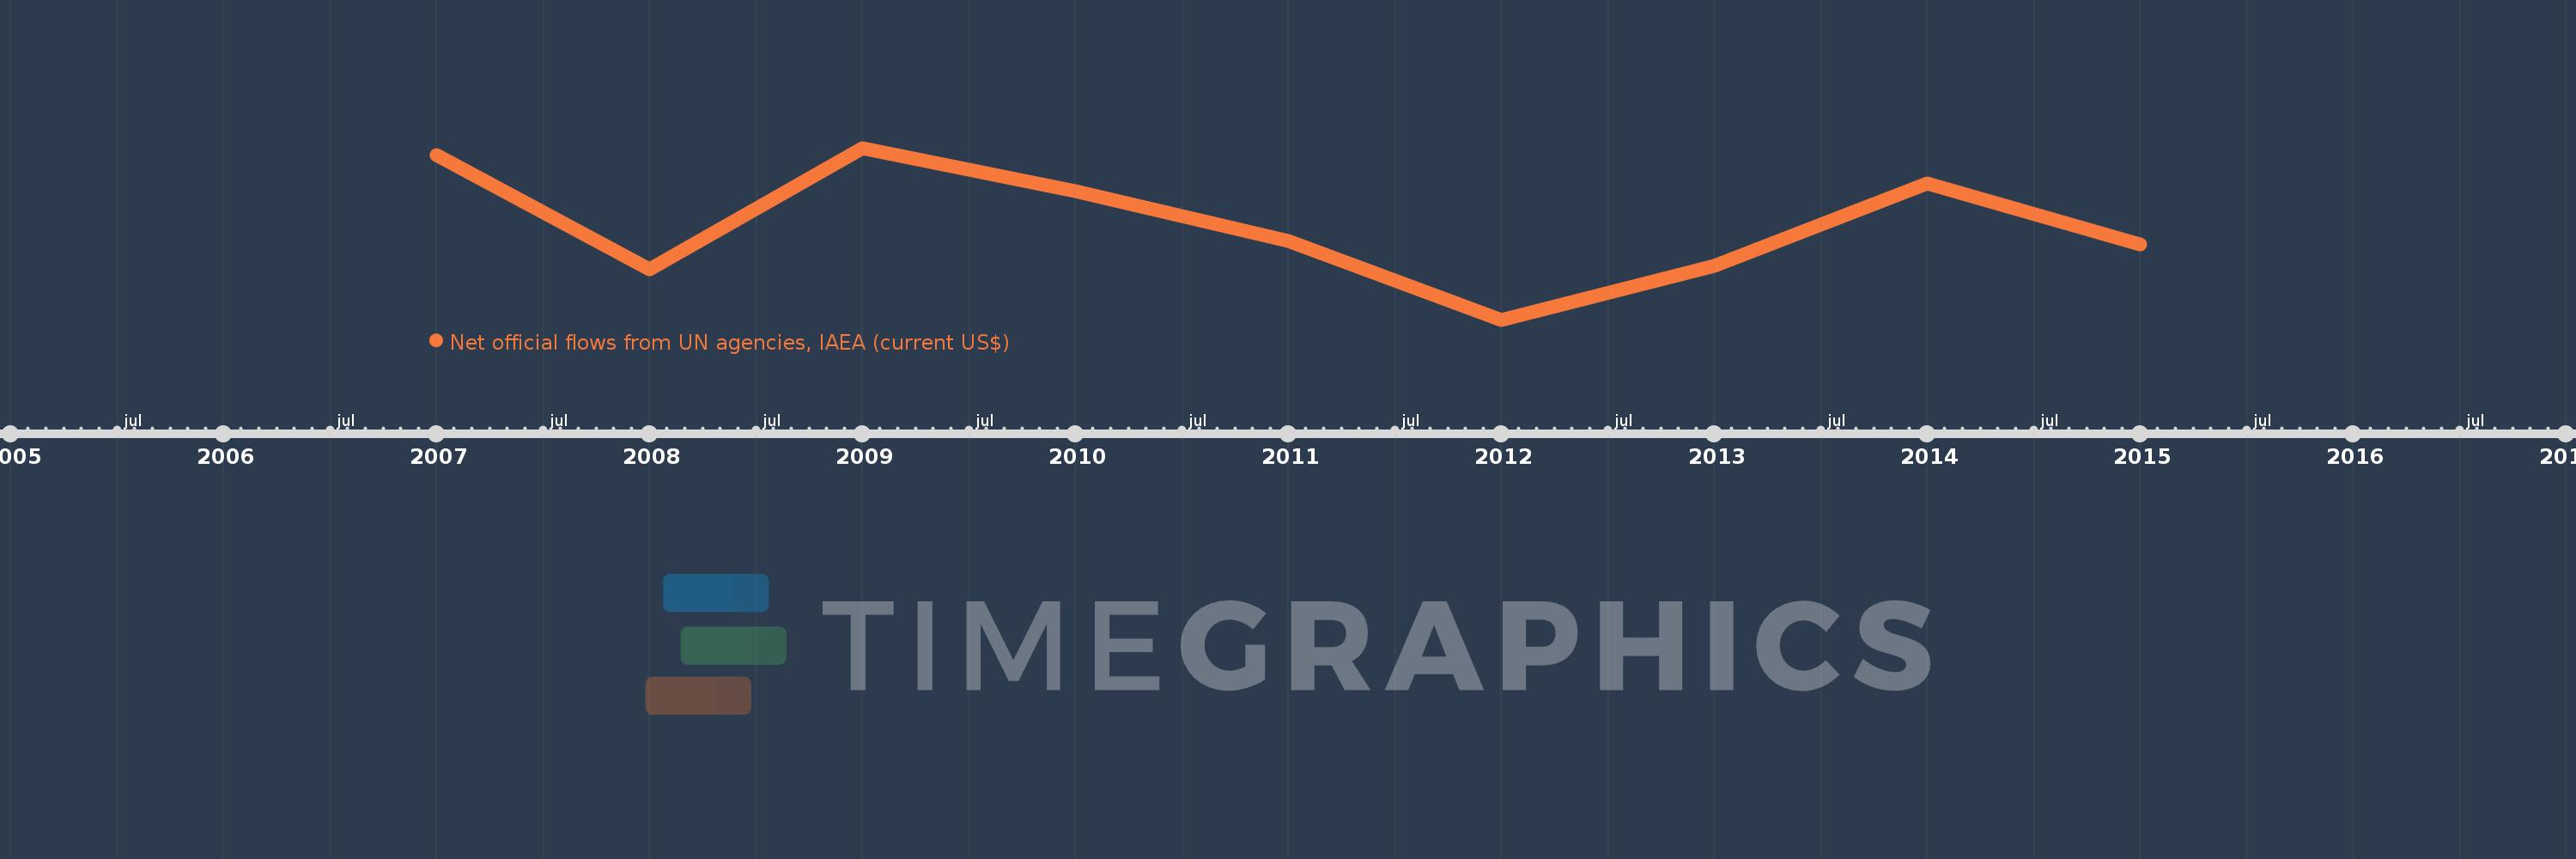
This timeline shows a graph from 2007 to 2015 of Tunisia. No data until 2006. Number of actual observations by date: 9.
Source name:
World Development Indicators
Source organization:
Development Assistance Committee of the Organisation for Economic Co-operation and Development, Geographical Distribution of Financial Flows to Developing Countries, Development Co-operation Report, and International Development Statistics database. Data are available online at: www.oecd.org/dac/stats/idsonline.
Categories, topics:
Aid Effectiveness
Last updated:
apr 23, 2017
Indicators value changes by year
Meaning:
446.667K
Minimum:
180.0K
jan 1, 2012
Maximum:
660.0K
jan 1, 2009
At the date of observation
Value
Absolute change
Change from the previous value
jan 1, 2007
640.0K
+640.0K
0.0%
jan 1, 2008
320.0K
-320.0K
-50.0%
jan 1, 2009
660.0K
+340.0K
106.25%
jan 1, 2010
540.0K
-120.0K
-18.18%
jan 1, 2011
400.0K
-140.0K
-25.93%
jan 1, 2012
180.0K
-220.0K
-55.0%
jan 1, 2013
330.0K
+150.0K
83.33%
jan 1, 2014
560.0K
+230.0K
69.7%
jan 1, 2015
390.0K
-170.0K
-30.36%
Ranking of countries by current statistics by years
