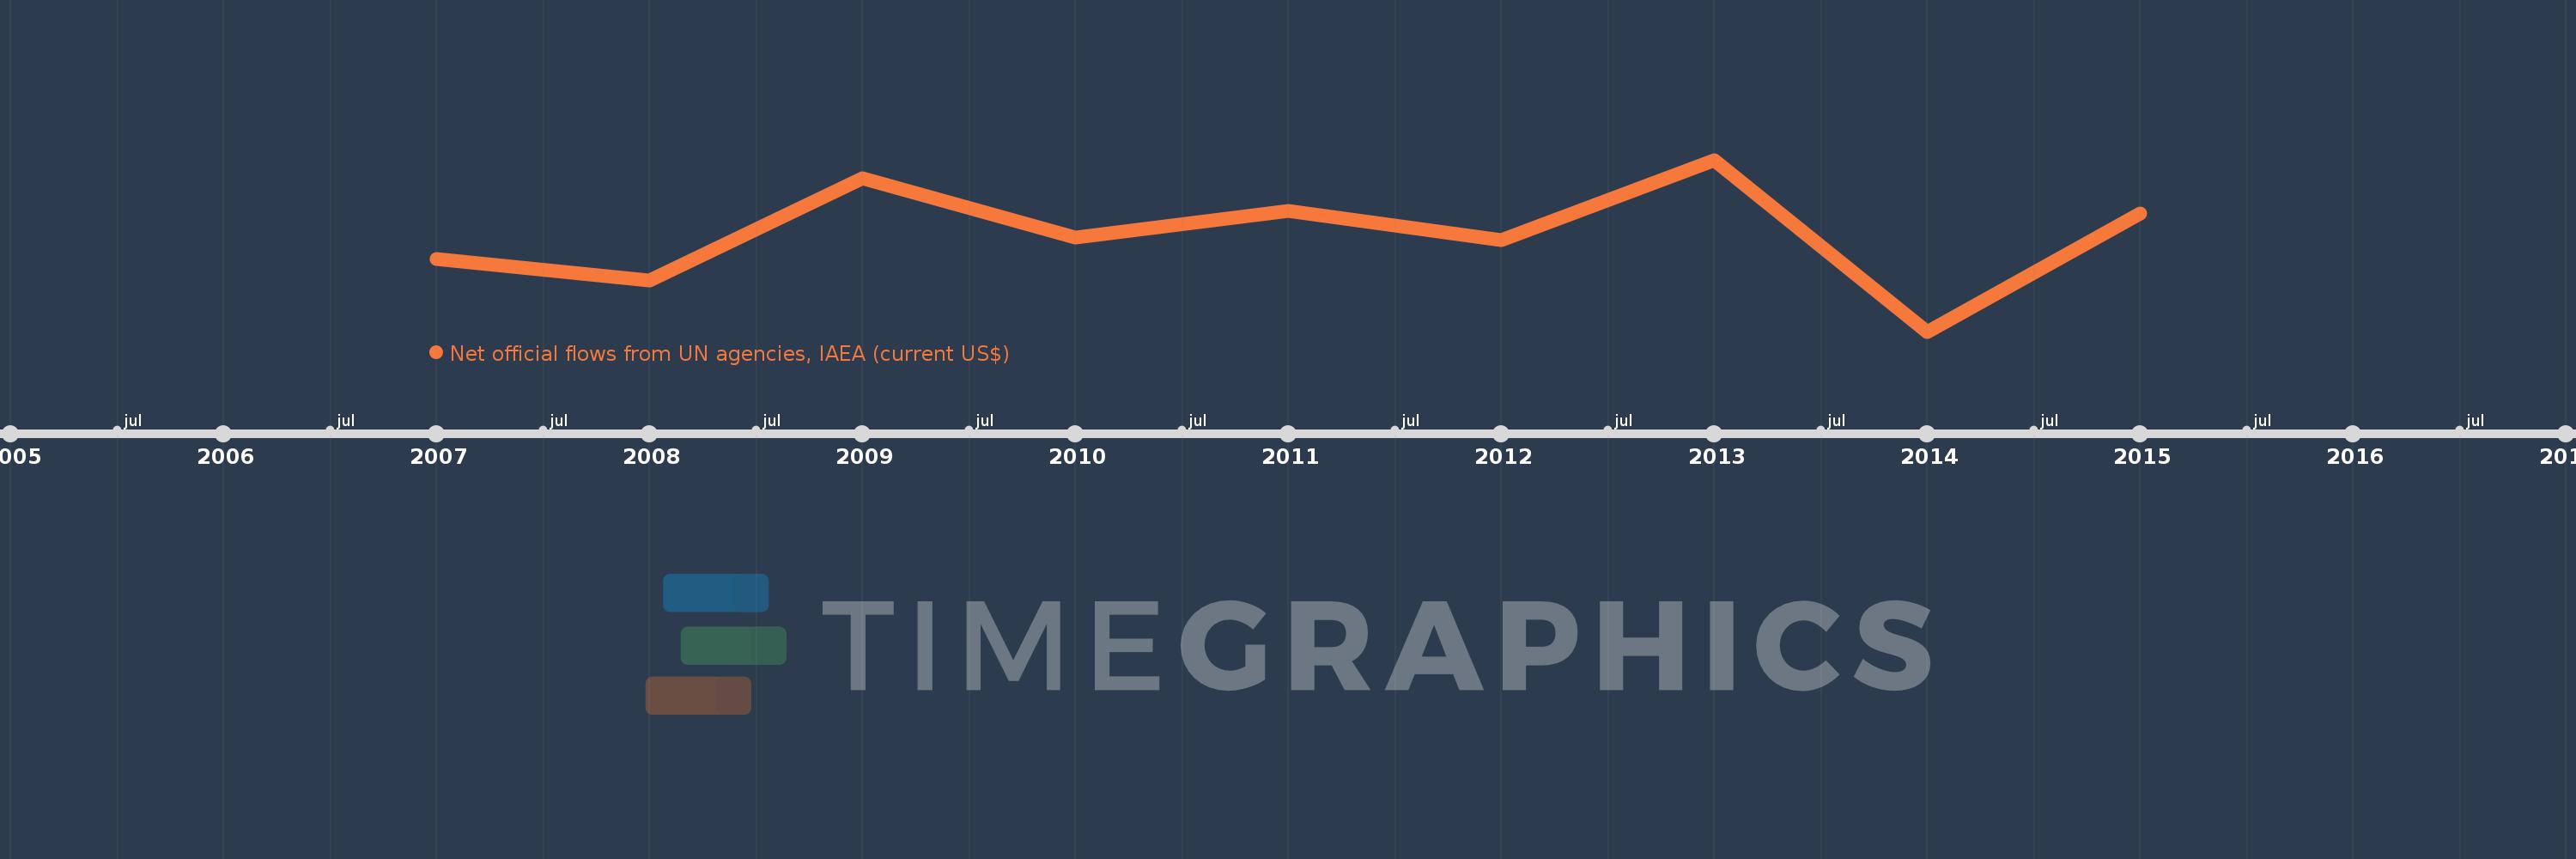
This timeline shows a graph from 2007 to 2015 of Cuba. No data until 2006. Number of actual observations by date: 9.
Source name:
World Development Indicators
Source organization:
Development Assistance Committee of the Organisation for Economic Co-operation and Development, Geographical Distribution of Financial Flows to Developing Countries, Development Co-operation Report, and International Development Statistics database. Data are available online at: www.oecd.org/dac/stats/idsonline.
Categories, topics:
Aid Effectiveness
Last updated:
apr 23, 2017
Indicators value changes by year
Meaning:
971.111K
Minimum:
610.0K
jan 1, 2014
Maximum:
1.25 mln
jan 1, 2013
At the date of observation
Value
Absolute change
Change from the previous value
jan 1, 2007
880.0K
+880.0K
0.0%
jan 1, 2008
800.0K
-80.0K
-9.09%
jan 1, 2009
1.18 mln
+380.0K
47.5%
jan 1, 2010
960.0K
-220.0K
-18.64%
jan 1, 2011
1.06 mln
+100.0K
10.42%
jan 1, 2012
950.0K
-110.0K
-10.38%
jan 1, 2013
1.25 mln
+300.0K
31.58%
jan 1, 2014
610.0K
-640.0K
-51.2%
jan 1, 2015
1.05 mln
+440.0K
72.13%
Ranking of countries by current statistics by years
