29
/
en
AIzaSyAYiBZKx7MnpbEhh9jyipgxe19OcubqV5w
April 1, 2024
266465
Tonga
TON
true
2
1
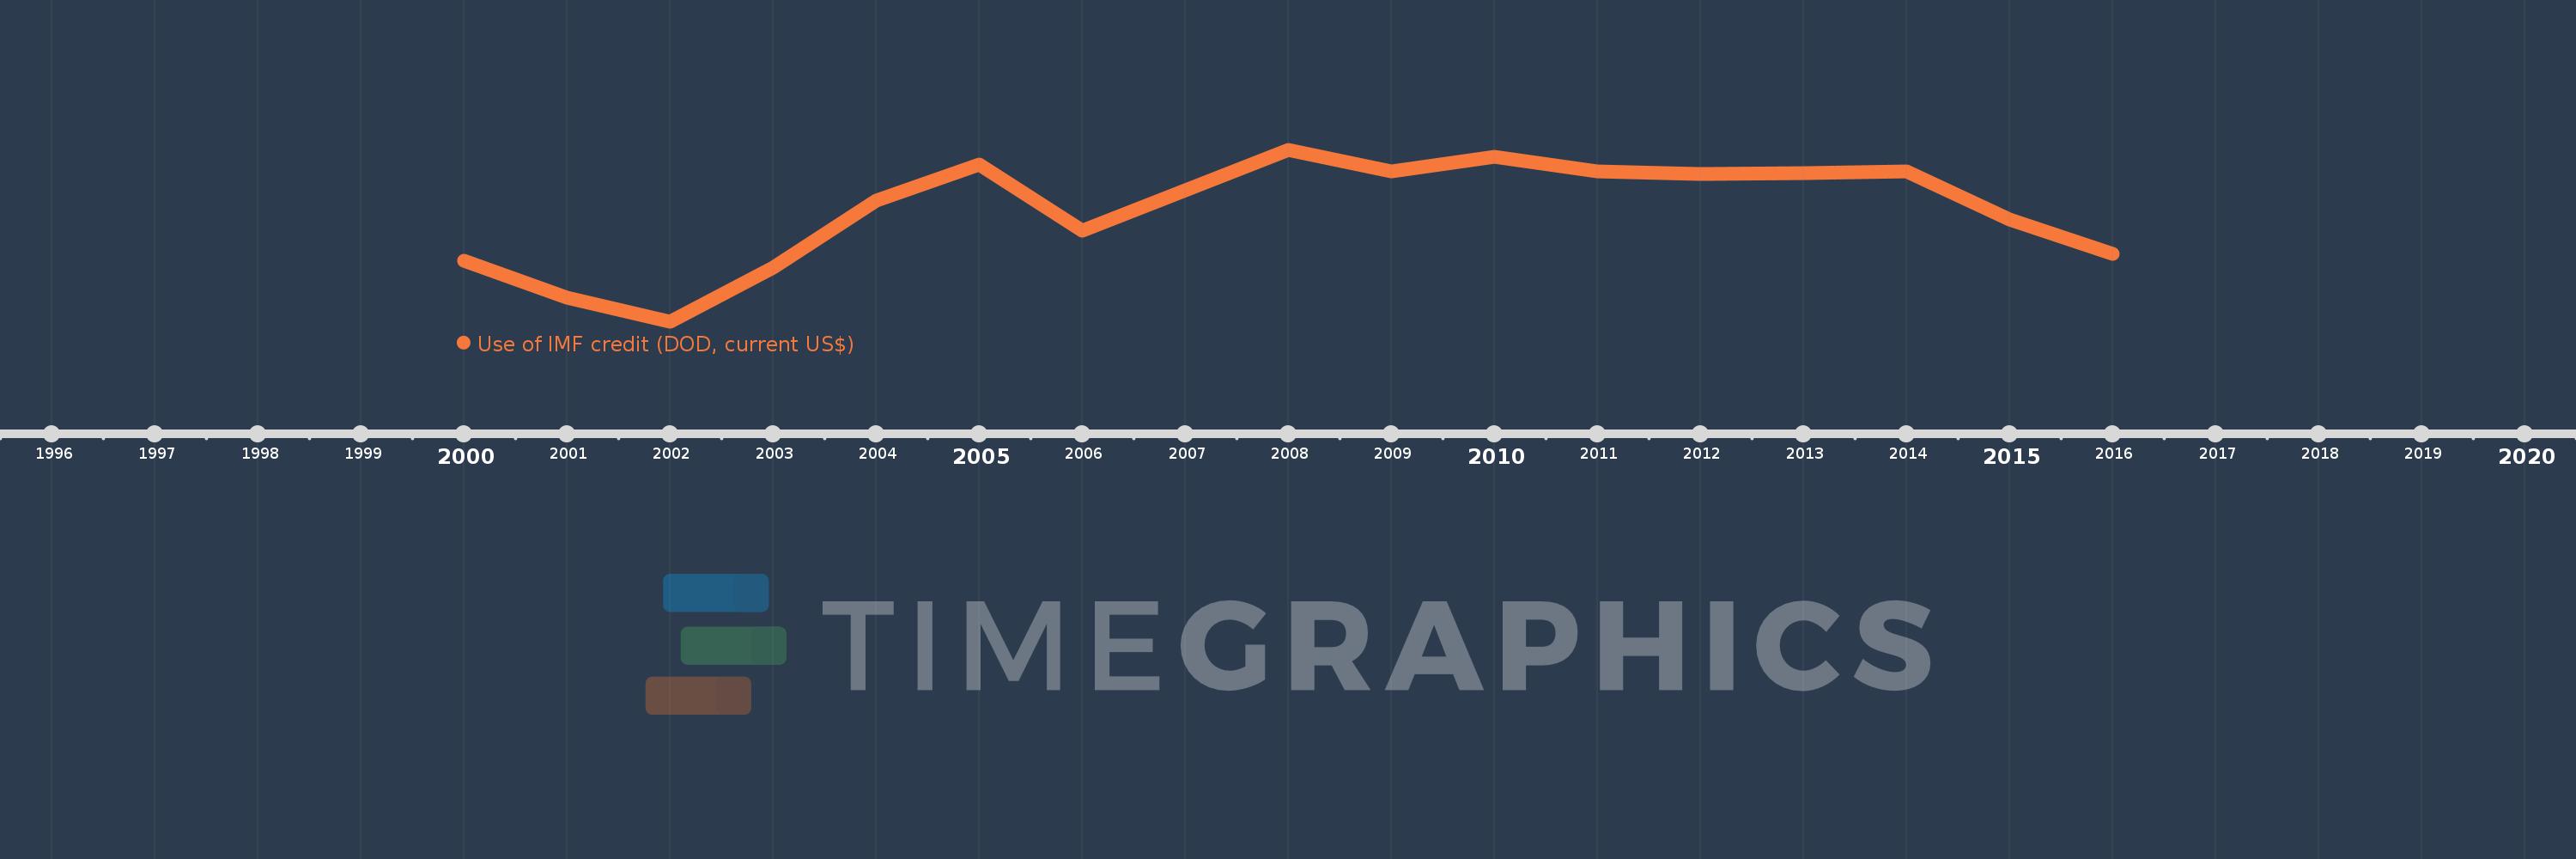
Use of IMF credit (DOD, current US$)
2016,2015,2014,2013,2012,2011,2010,2009,2008,2007,2006,2005,2004,2003,2002,2001,2000
This statistics in other country:
Timeline:
This timeline shows a graph from 2000 to 2016 of Tonga. No data until 1999. Number of actual observations by date: 17.
Source name:
World Development Indicators
Source organization:
World Bank, International Debt Statistics.
Categories, topics:
External Debt
Last updated:
apr 23, 2017
Indicators value changes by year
Minimum:
8.27 mln
jan 1, 2002
Maximum:
10.399 mln
jan 1, 2008
At the date of observation
Value
Absolute change
Change from previous value
jan 1, 2000
9.032 mln
+9.032 mln
0.0%
jan 1, 2001
8.574 mln
-458.0K
-5.07%
jan 1, 2002
8.27 mln
-304.0K
-3.55%
jan 1, 2003
8.947 mln
+677.0K
8.19%
jan 1, 2004
9.779 mln
+832.0K
9.3%
jan 1, 2005
10.22 mln
+441.0K
4.51%
jan 1, 2006
9.406 mln
-814.0K
-7.96%
jan 1, 2007
9.9 mln
+494.0K
5.25%
jan 1, 2008
10.399 mln
+499.0K
5.04%
jan 1, 2009
10.136 mln
-263.0K
-2.53%
jan 1, 2010
10.317 mln
+181.0K
1.79%
jan 1, 2011
10.135 mln
-182.0K
-1.76%
jan 1, 2012
10.103 mln
-32.0K
-0.32%
jan 1, 2013
10.114 mln
+11.0K
0.11%
jan 1, 2014
10.134 mln
+20.0K
0.2%
jan 1, 2015
9.535 mln
-599.0K
-5.91%
jan 1, 2016
9.119 mln
-416.0K
-4.36%
Ranking of countries by current statistics by years


Comments: