29
/
en
AIzaSyAYiBZKx7MnpbEhh9jyipgxe19OcubqV5w
April 1, 2024
252609
St. Vincent and the Grenadines
VCT
true
2
1
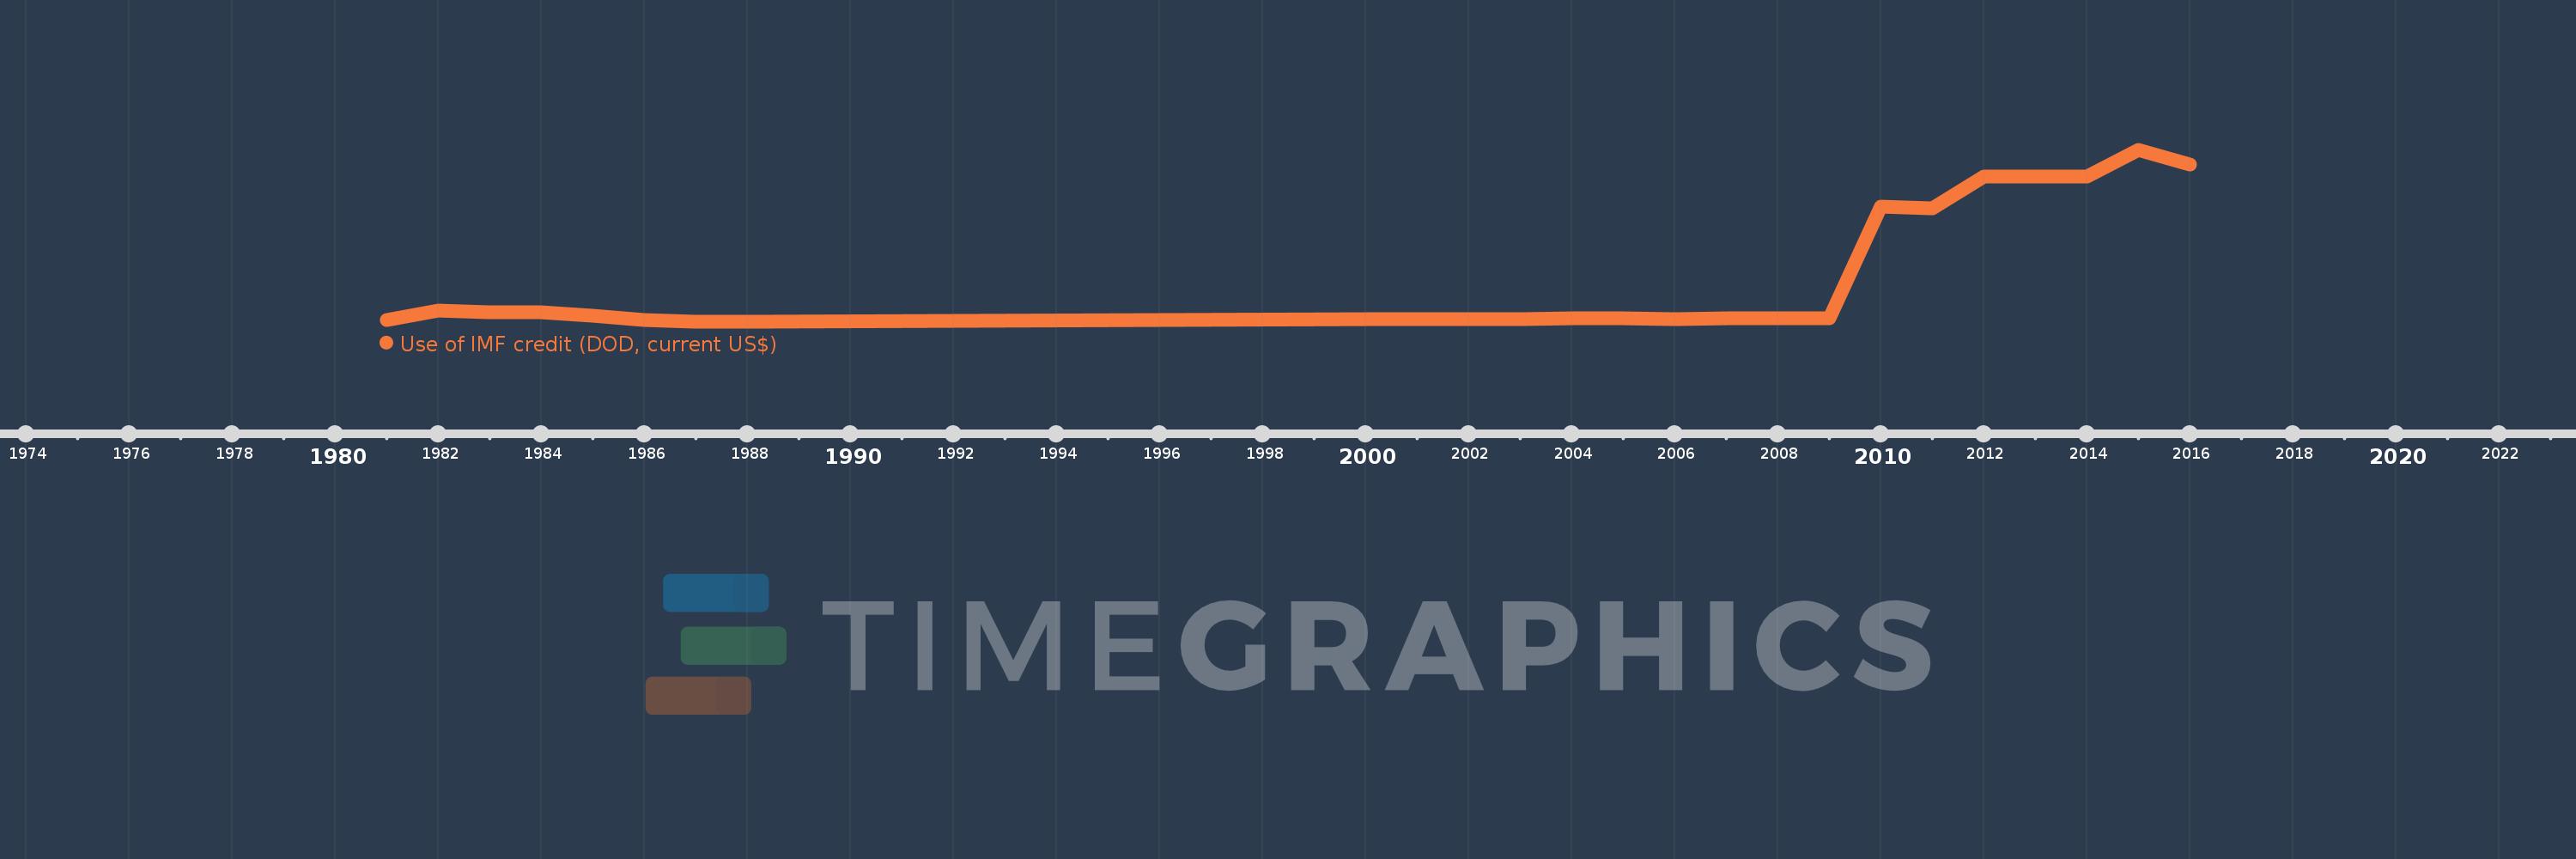
Use of IMF credit (DOD, current US$)
2016,2015,2014,2013,2012,2011,2010,2009,2008,2007,2006,2005,2004,2003,2002,2001,2000,1988,1987,1986,1985,1984,1983,1982,1981
This statistics in other country:
Timeline:
This timeline shows a graph from 1981 to 2016 of St. Vincent and the Grenadines. No data until 1980. Number of actual observations by date: 25.
Source name:
World Development Indicators
Source organization:
World Bank, International Debt Statistics.
Categories, topics:
External Debt
Last updated:
apr 23, 2017
Indicators value changes by year
Maximum:
27.156 mln
jan 1, 2015
At the date of observation
Value
Absolute change
Change from previous value
jan 1, 1981
300.0K
+300.0K
0.0%
jan 1, 1982
1.8 mln
+1.5 mln
500.0%
jan 1, 1983
1.6 mln
-200.0K
-11.11%
jan 1, 1984
1.57 mln
-30.0K
-1.88%
jan 1, 1985
990.0K
-580.0K
-36.94%
jan 1, 1986
330.0K
-660.0K
-66.67%
jan 1, 1987
0.0
-330.0K
-100.0%
jan 1, 2000
485.0K
+485.0K
%
jan 1, 2001
461.0K
-24.0K
-4.95%
jan 1, 2002
444.0K
-17.0K
-3.69%
jan 1, 2003
481.0K
+37.0K
8.33%
jan 1, 2004
525.0K
+44.0K
9.15%
jan 1, 2005
549.0K
+24.0K
4.57%
jan 1, 2006
505.0K
-44.0K
-8.01%
jan 1, 2007
532.0K
+27.0K
5.35%
jan 1, 2008
559.0K
+27.0K
5.08%
jan 1, 2009
545.0K
-14.0K
-2.5%
jan 1, 2010
18.258 mln
+17.713 mln
3.25K%
jan 1, 2011
17.936 mln
-322.0K
-1.76%
jan 1, 2012
22.978 mln
+5.042 mln
28.11%
jan 1, 2013
23.003 mln
+25.0K
0.11%
jan 1, 2014
23.049 mln
+46.0K
0.2%
jan 1, 2015
27.156 mln
+4.107 mln
17.82%
jan 1, 2016
24.939 mln
-2.217 mln
-8.16%
Ranking of countries by current statistics by years


Comments: