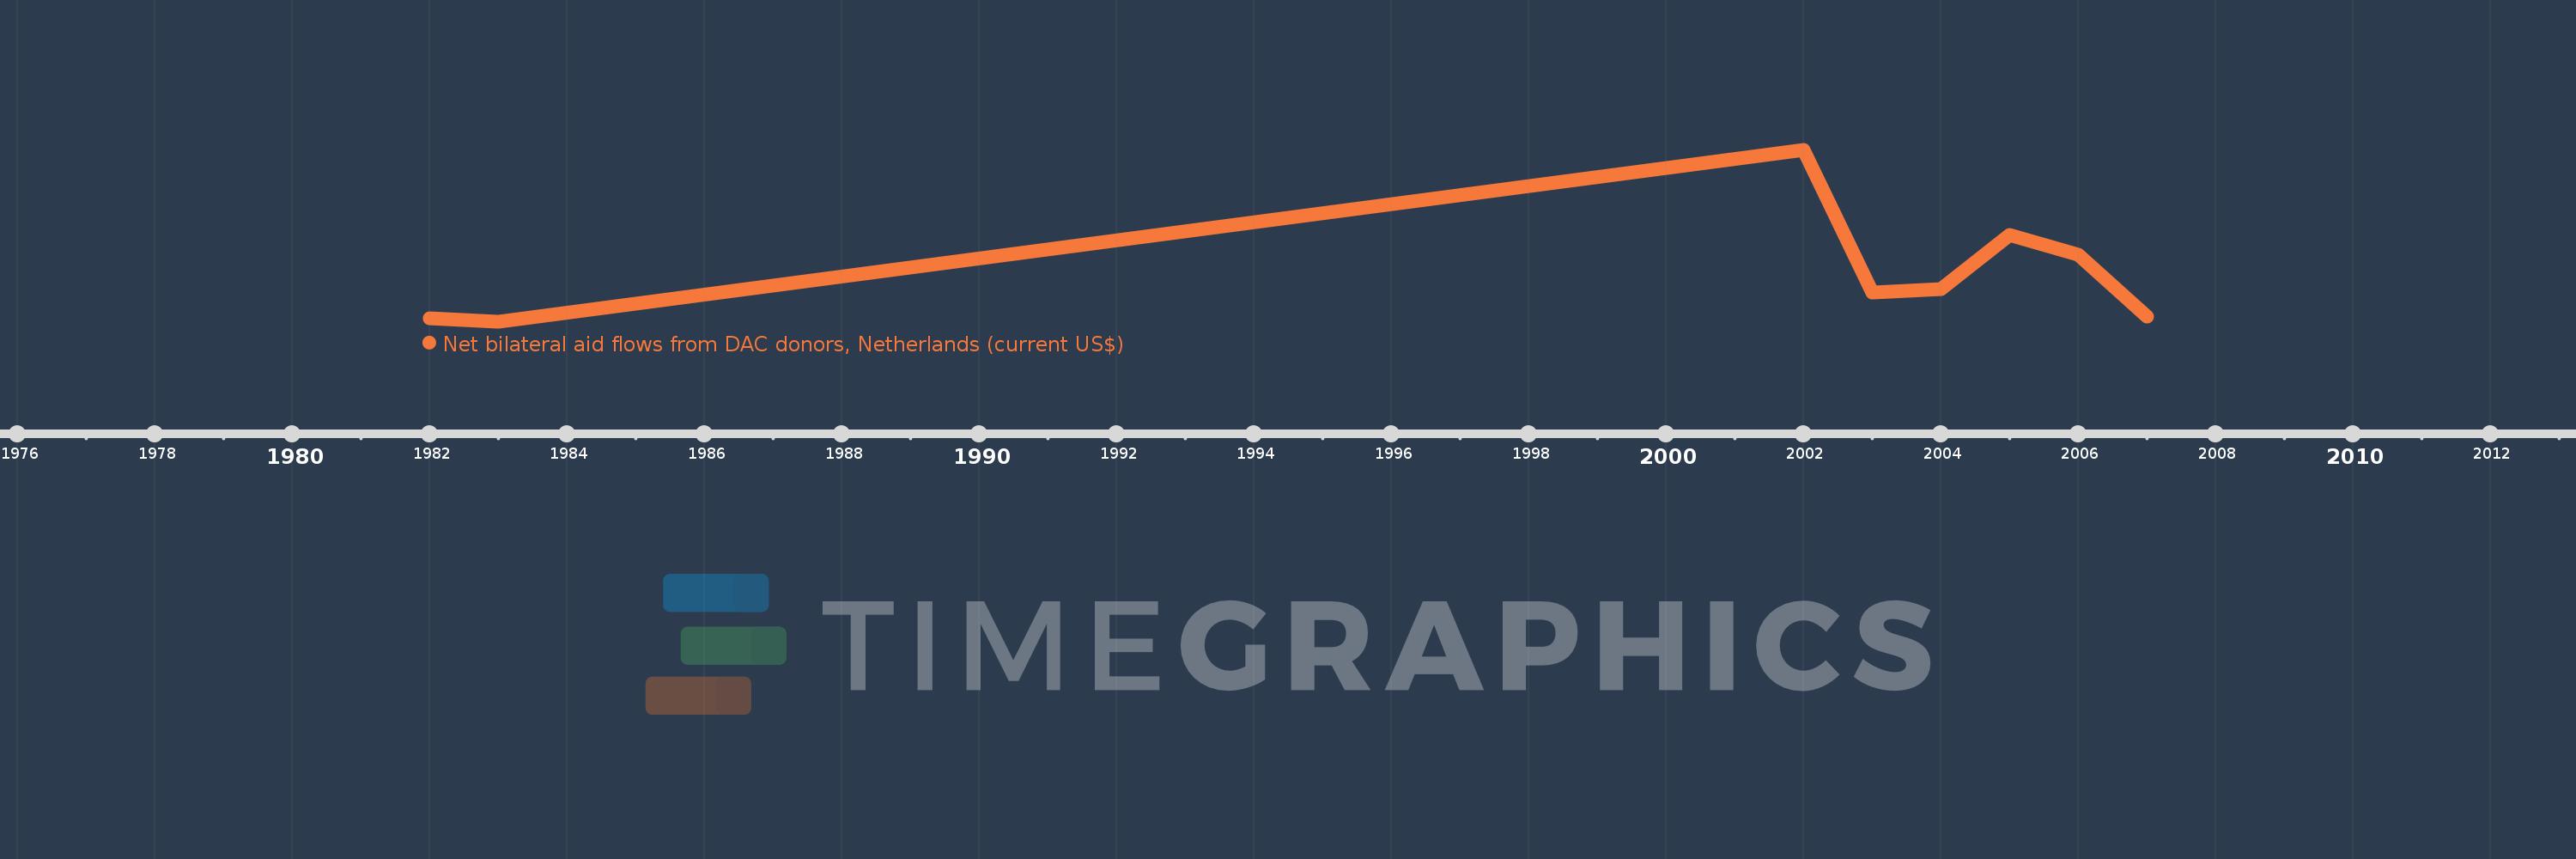
This timeline shows a graph from 1982 to 2007 of Timor-Leste. No data until 1981. Number of actual observations by date: 8.
Source name:
World Development Indicators
Source organization:
Development Assistance Committee of the Organisation for Economic Co-operation and Development, Geographical Distribution of Financial Flows to Developing Countries, Development Co-operation Report, and International Development Statistics database. Data are available online at: www.oecd.org/dac/stats/idsonline.
Categories, topics:
Aid Effectiveness
Last updated:
apr 23, 2017
Indicators value changes by year
Meaning:
863.75K
Minimum:
150.0K
jan 1, 1983
Maximum:
2.62 mln
jan 1, 2002
At the date of observation
Value
Absolute change
Change from the previous value
jan 1, 1982
200.0K
+200.0K
0.0%
jan 1, 1983
150.0K
-50.0K
-25.0%
jan 1, 2002
2.62 mln
+2.47 mln
1.65K%
jan 1, 2003
570.0K
-2.05 mln
-78.24%
jan 1, 2004
620.0K
+50.0K
8.77%
jan 1, 2005
1.4 mln
+780.0K
125.81%
jan 1, 2006
1.12 mln
-280.0K
-20.0%
jan 1, 2007
230.0K
-890.0K
-79.46%
Ranking of countries by current statistics by years
