30
/
AIzaSyAYiBZKx7MnpbEhh9jyipgxe19OcubqV5w
April 1, 2024
233872
Sao Tome and Principe
STP
true
2
1
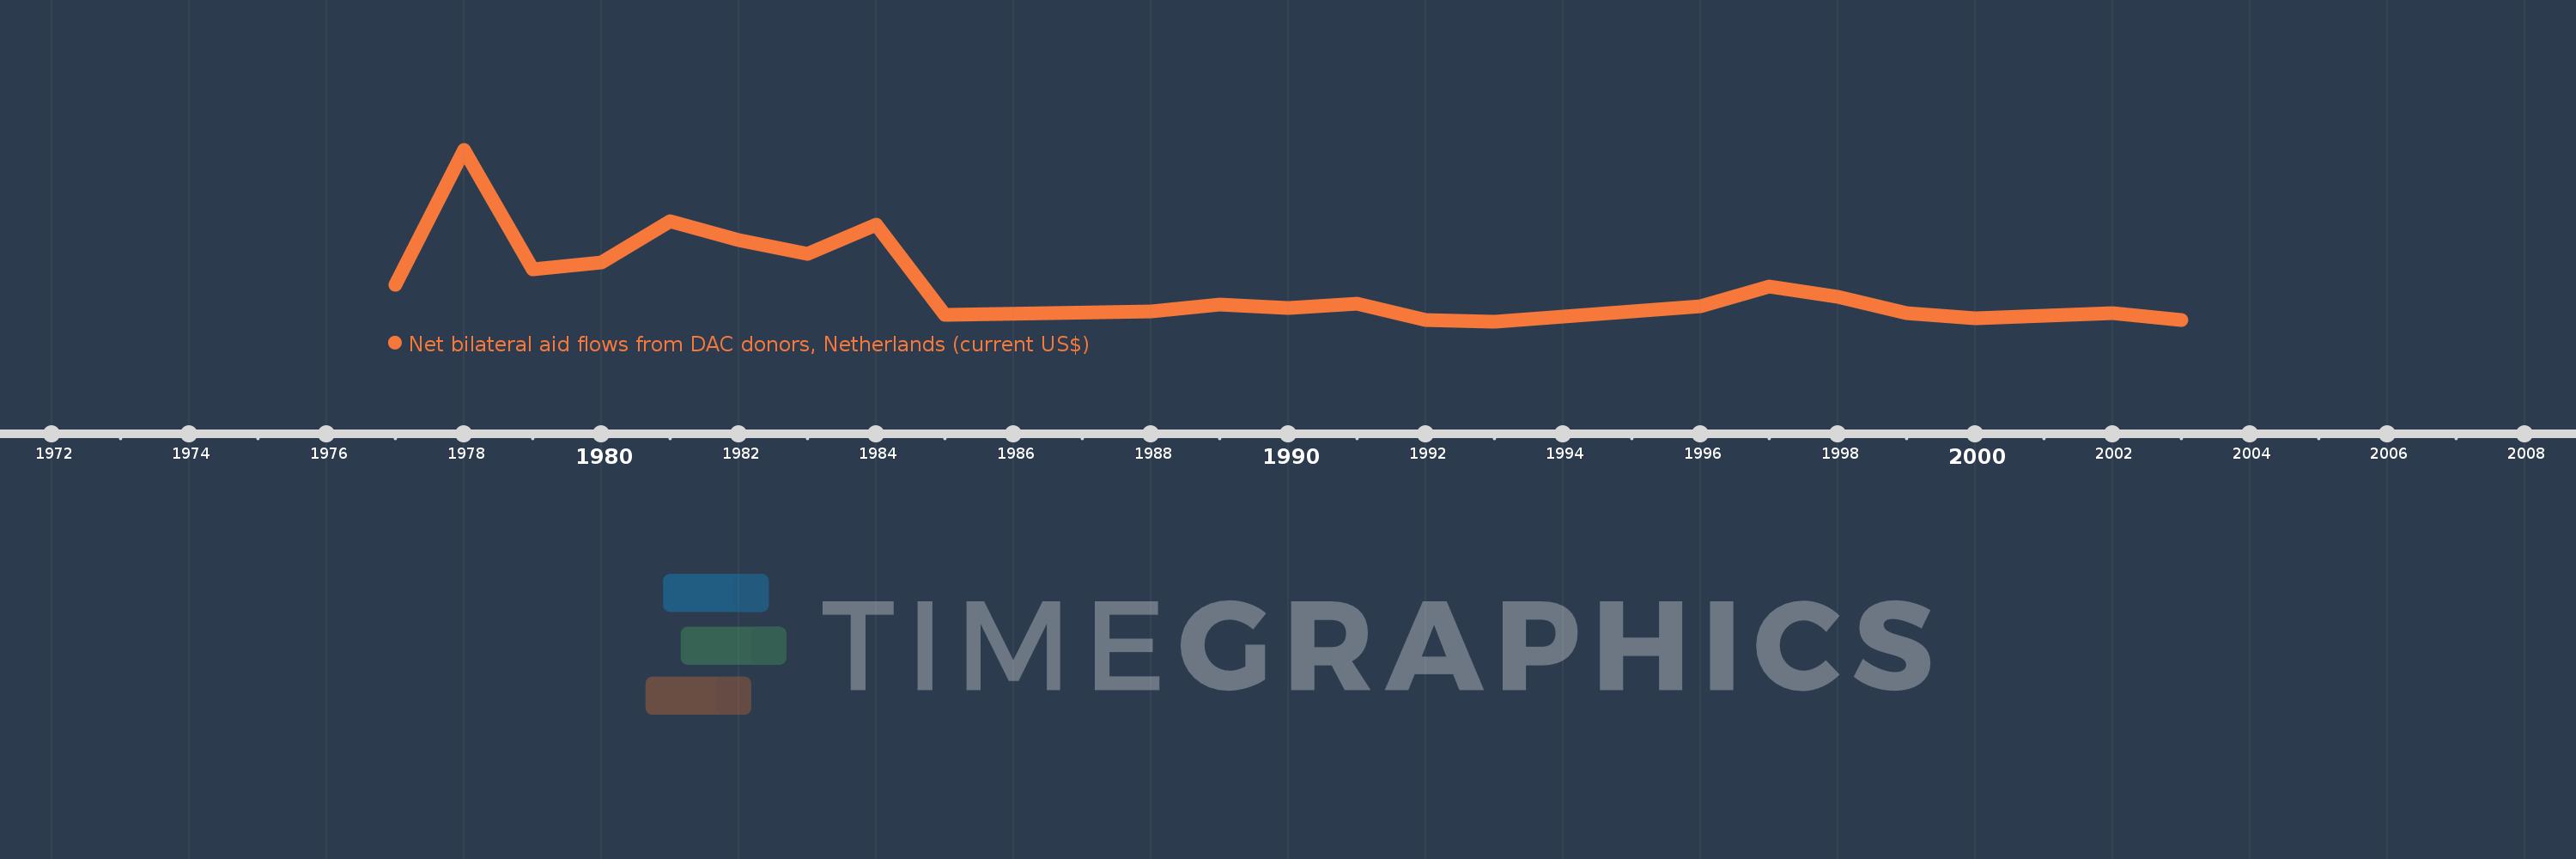
Net bilateral aid flows from DAC donors, Netherlands (current US$)
2003,2002,2000,1999,1998,1997,1996,1993,1992,1991,1990,1989,1988,1985,1984,1983,1982,1981,1980,1979,1978,1977
