30
/
AIzaSyAYiBZKx7MnpbEhh9jyipgxe19OcubqV5w
April 1, 2024
260890
Tanzania
TZA
true
2
1
GDP (current LCU)
2016,2015,2014,2013,2012,2011,2010,2009,2008,2007,2006,2005,2004,2003,2002,2001,2000,1999,1998,1997,1996,1995,1994,1993,1992,1991,1990,1989
Public Timelines
FAQ
Menu
Public Timelines
FAQ
Public Timelines
FAQ
For education
For educational institutions
For teachers
For students
Open cabinet
For educational institutions
For teachers
For students
Open cabinet
Create
Close
Create a timeline
Public timelines
Library
FAQ
Download
Global statistics library
→
Tanzania
→
GDP (current LCU)
This statistics in other country:
Afghanistan
Albania
Algeria
Andorra
Angola
Antigua and Barbuda
Argentina
Armenia
Aruba
Australia
Austria
Azerbaijan
Bahamas, The
Bahrain
Bangladesh
Barbados
Belarus
Belgium
Belize
Benin
Bermuda
Bhutan
Bolivia
Bosnia and Herzegovina
Botswana
Brazil
Brunei Darussalam
Bulgaria
Burkina Faso
Burundi
Cabo Verde
Cambodia
Cameroon
Canada
Cayman Islands
Central African Republic
Chad
Channel Islands
Chile
China
Colombia
Comoros
Congo, Dem. Rep.
Congo, Rep.
Costa Rica
Cote d'Ivoire
Croatia
Cuba
Cyprus
Czech Republic
Denmark
Djibouti
Dominica
Dominican Republic
Ecuador
Egypt, Arab Rep.
El Salvador
Equatorial Guinea
Eritrea
Estonia
Ethiopia
Faroe Islands
Fiji
Finland
France
French Polynesia
Gabon
Gambia, The
Georgia
Germany
Ghana
Greece
Greenland
Grenada
Guatemala
Guinea
Guinea-Bissau
Guyana
Haiti
Honduras
Hong Kong SAR, China
Hungary
Iceland
India
Indonesia
Iran, Islamic Rep.
Iraq
Ireland
Isle of Man
Israel
Italy
Jamaica
Japan
Jordan
Kazakhstan
Kenya
Kiribati
Korea, Rep.
Kosovo
Kuwait
Kyrgyz Republic
Lao PDR
Latvia
Lebanon
Lesotho
Liberia
Libya
Liechtenstein
Lithuania
Luxembourg
Macao SAR, China
Macedonia, FYR
Madagascar
Malawi
Malaysia
Maldives
Mali
Malta
Marshall Islands
Mauritania
Mauritius
Mexico
Micronesia, Fed. Sts.
Moldova
Monaco
Mongolia
Montenegro
Morocco
Mozambique
Myanmar
Namibia
Nauru
Nepal
Netherlands
New Caledonia
New Zealand
Nicaragua
Niger
Nigeria
Norway
Oman
Pakistan
Palau
Panama
Papua New Guinea
Paraguay
Peru
Philippines
Poland
Portugal
Puerto Rico
Qatar
Romania
Russian Federation
Rwanda
Samoa
San Marino
Sao Tome and Principe
Saudi Arabia
Senegal
Serbia
Seychelles
Sierra Leone
Singapore
Sint Maarten (Dutch part)
Slovak Republic
Slovenia
Solomon Islands
Somalia
South Africa
South Sudan
Spain
Sri Lanka
St. Kitts and Nevis
St. Lucia
St. Vincent and the Grenadines
Sudan
Suriname
Swaziland
Sweden
Switzerland
Syrian Arab Republic
Tajikistan
Tanzania
Thailand
Timor-Leste
Togo
Tonga
Trinidad and Tobago
Tunisia
Turkey
Turkmenistan
Tuvalu
Uganda
Ukraine
United Arab Emirates
United Kingdom
United States
Uruguay
Uzbekistan
Vanuatu
Venezuela, RB
Vietnam
Virgin Islands (U.S.)
West Bank and Gaza
Yemen, Rep.
Zambia
Zimbabwe
Timeline:
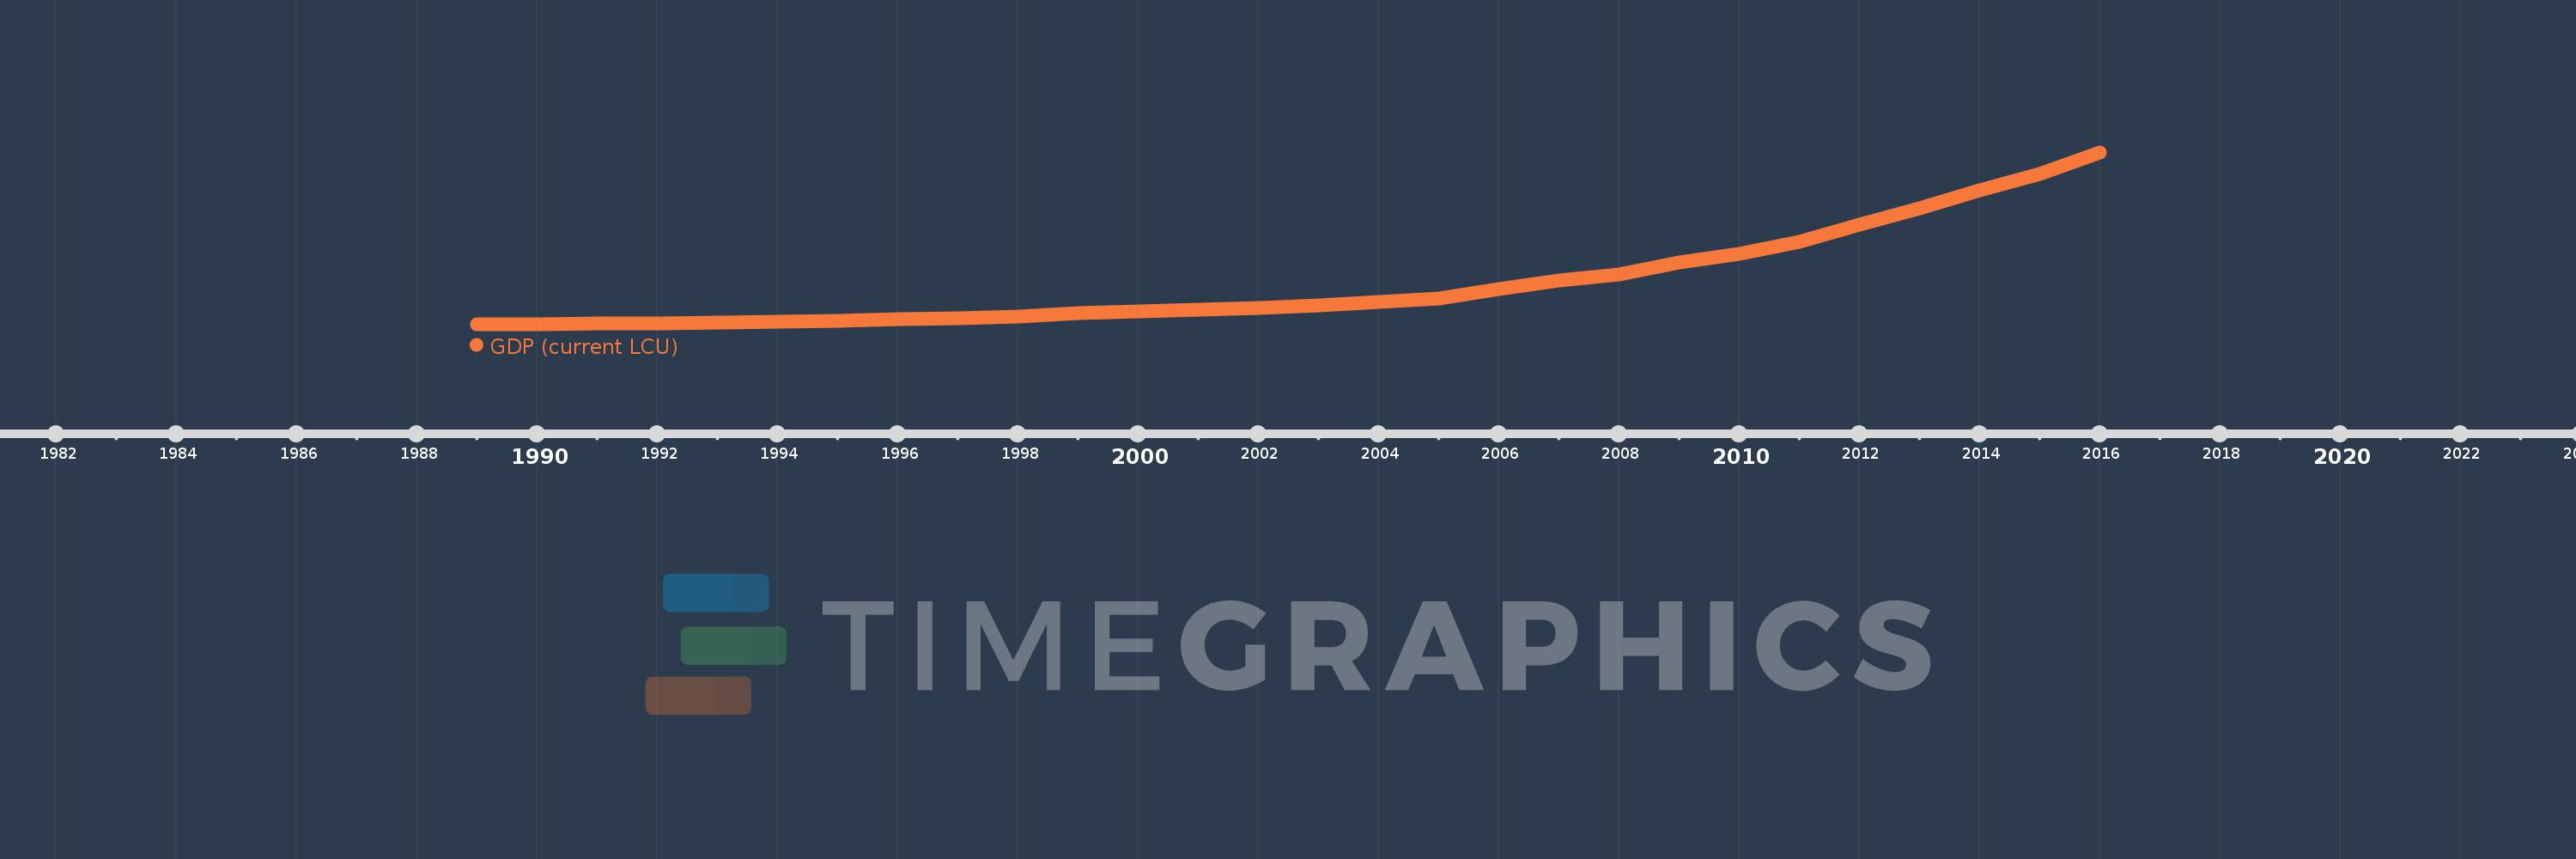
This timeline shows a graph from
1989
to
2016
of Tanzania. No data until
1988
. Number of actual observations by date:
28
.
Source name:
World Development Indicators
Source organization:
World Bank national accounts data, and OECD National Accounts data files.
Categories, topics:
Economy & Growth
Last updated:
apr 23, 2017
Indicators value changes by year
Meaning:
22.371 trl
Minimum:
506.43 bln
jan 1, 1989
Maximum:
90.864 trl
jan 1, 2016
At the date of observation
Value
Absolute change
Change from the previous value
jan 1, 1989
506.43 bln
+506.43 bln
0.0%
jan 1, 1990
633.75 bln
+127.32 bln
25.14%
jan 1, 1991
830.693 bln
+196.943 bln
31.08%
jan 1, 1992
1.086 trl
+255.58 bln
30.77%
jan 1, 1993
1.37 trl
+283.605 bln
26.11%
jan 1, 1994
1.726 trl
+355.658 bln
25.96%
jan 1, 1995
2.299 trl
+573.331 bln
33.23%
jan 1, 1996
3.021 trl
+721.633 bln
31.39%
jan 1, 1997
3.768 trl
+747.142 bln
24.74%
jan 1, 1998
4.703 trl
+935.817 bln
24.84%
jan 1, 1999
6.211 trl
+1.508 trl
32.06%
jan 1, 2000
7.223 trl
+1.011 trl
16.28%
jan 1, 2001
8.153 trl
+930.23 bln
12.88%
jan 1, 2002
9.1 trl
+947.484 bln
11.62%
jan 1, 2003
10.445 trl
+1.344 trl
14.77%
jan 1, 2004
12.107 trl
+1.663 trl
15.92%
jan 1, 2005
13.972 trl
+1.865 trl
15.4%
jan 1, 2006
19.113 trl
+5.141 trl
36.8%
jan 1, 2007
23.298 trl
+4.186 trl
21.9%
jan 1, 2008
26.77 trl
+3.472 trl
14.9%
jan 1, 2009
32.765 trl
+5.995 trl
22.39%
jan 1, 2010
37.727 trl
+4.962 trl
15.14%
jan 1, 2011
43.836 trl
+6.109 trl
16.19%
jan 1, 2012
52.763 trl
+8.927 trl
20.36%
jan 1, 2013
61.434 trl
+8.672 trl
16.44%
jan 1, 2014
70.953 trl
+9.519 trl
15.49%
jan 1, 2015
79.718 trl
+8.765 trl
12.35%
jan 1, 2016
90.864 trl
+11.145 trl
13.98%
Ranking of countries by current statistics by years
About & Feedback
Terms
Privacy
Library
2024
©
Time.Graphics
Support 24/7
Cabinet
Get premium
Donate
The service accepts bank transfer (ACH, Wire) or cards (Visa, MasterCard, etc). Processed by Stripe.
Secured with SSL
Excellent (Trustpilot Reviews)
Based on 115+ reviews
Write your own review on
Trustpilot.com
