29
/
en
AIzaSyAYiBZKx7MnpbEhh9jyipgxe19OcubqV5w
April 1, 2024
160080
Isle of Man
IMN
true
2
1
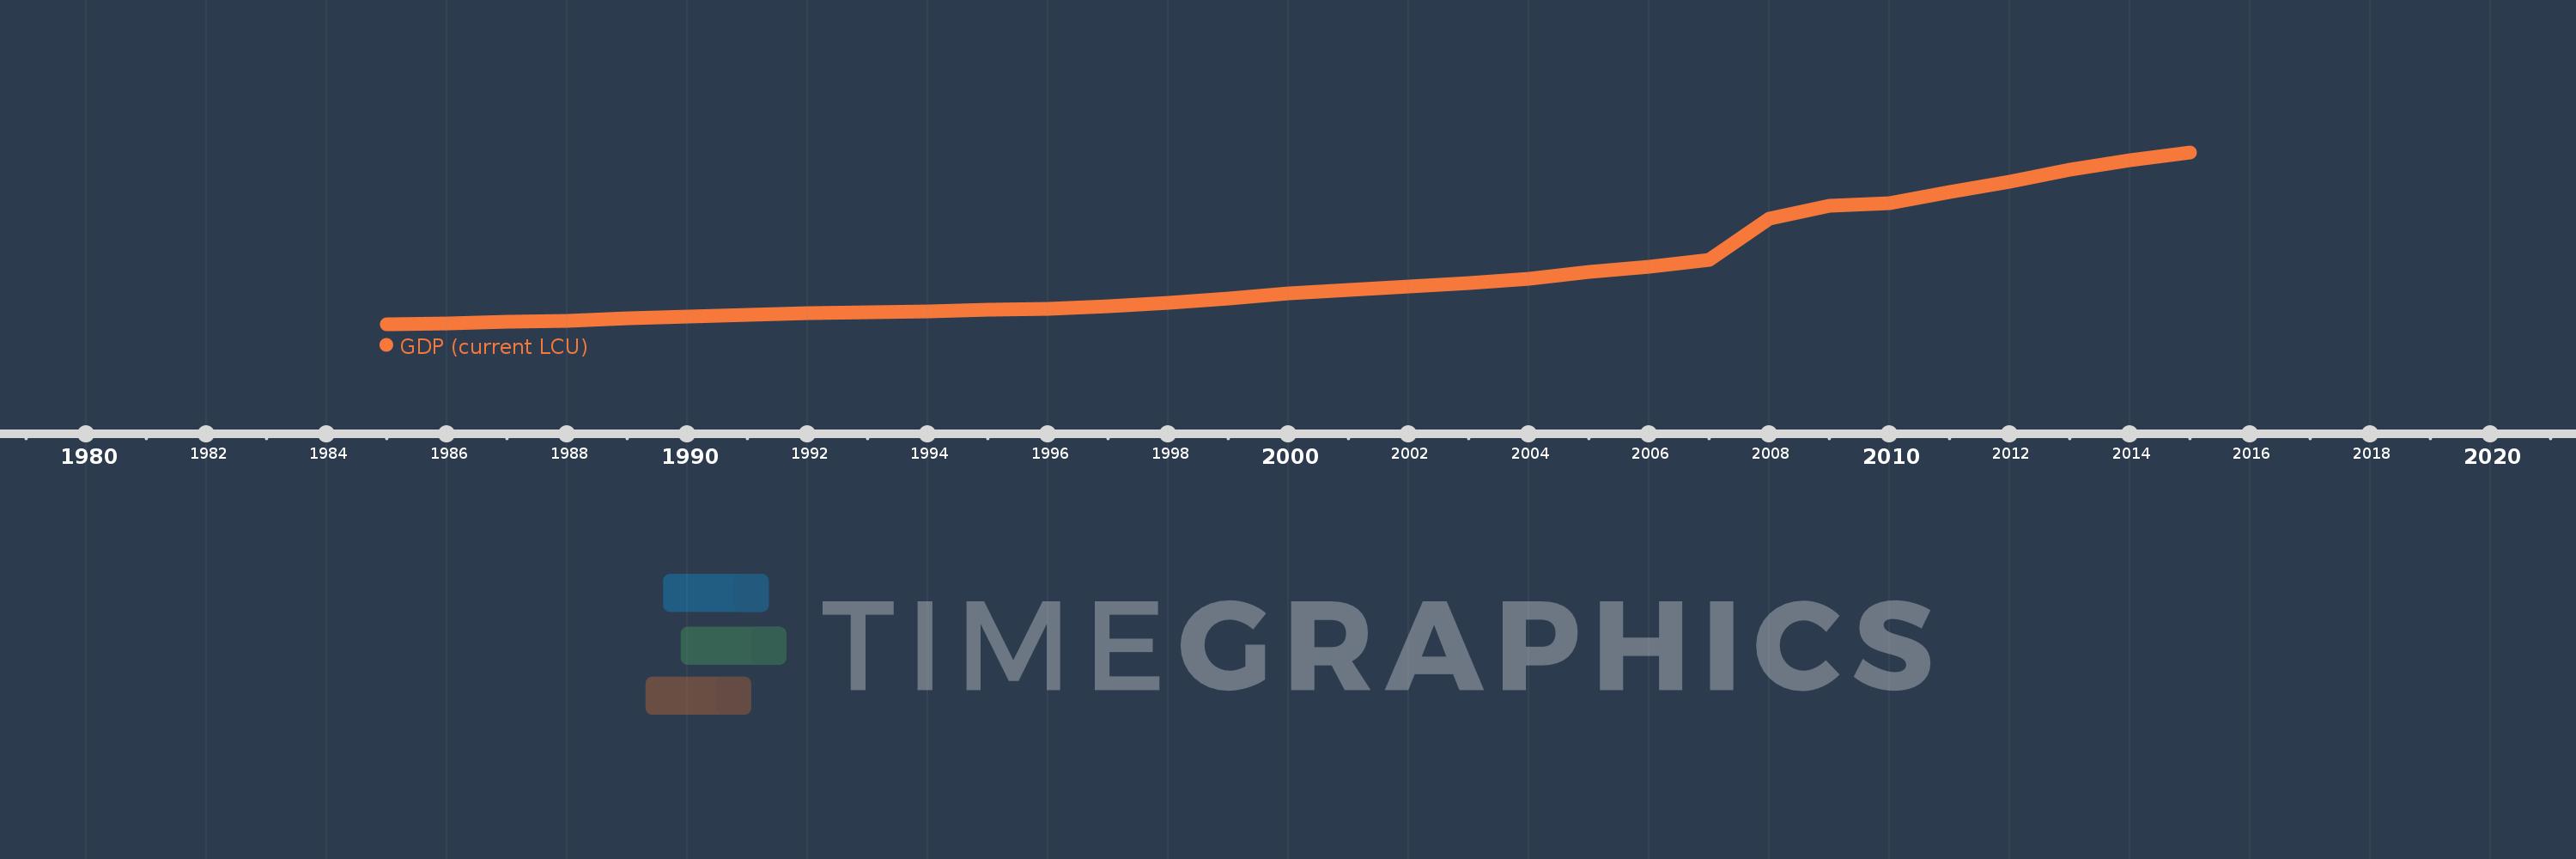
GDP (current LCU)
2015,2014,2013,2012,2011,2010,2009,2008,2007,2006,2005,2004,2003,2002,2001,2000,1999,1998,1997,1996,1995,1994,1993,1992,1991,1990,1989,1988,1987,1986,1985
This statistics in other country:
AfghanistanAlbaniaAlgeriaAndorraAngolaAntigua and BarbudaArgentinaArmeniaArubaAustraliaAustriaAzerbaijanBahamas, TheBahrainBangladeshBarbadosBelarusBelgiumBelizeBeninBermudaBhutanBoliviaBosnia and HerzegovinaBotswanaBrazilBrunei DarussalamBulgariaBurkina FasoBurundiCabo VerdeCambodiaCameroonCanadaCayman IslandsCentral African RepublicChadChannel IslandsChileChinaColombiaComorosCongo, Dem. Rep.Congo, Rep.Costa RicaCote d'IvoireCroatiaCubaCyprusCzech RepublicDenmarkDjiboutiDominicaDominican RepublicEcuadorEgypt, Arab Rep.El SalvadorEquatorial GuineaEritreaEstoniaEthiopiaFaroe IslandsFijiFinlandFranceFrench PolynesiaGabonGambia, TheGeorgiaGermanyGhanaGreeceGreenlandGrenadaGuatemalaGuineaGuinea-BissauGuyanaHaitiHondurasHong Kong SAR, ChinaHungaryIcelandIndiaIndonesiaIran, Islamic Rep.IraqIrelandIsle of ManIsraelItalyJamaicaJapanJordanKazakhstanKenyaKiribatiKorea, Rep.KosovoKuwaitKyrgyz RepublicLao PDRLatviaLebanonLesothoLiberiaLibyaLiechtensteinLithuaniaLuxembourgMacao SAR, ChinaMacedonia, FYRMadagascarMalawiMalaysiaMaldivesMaliMaltaMarshall IslandsMauritaniaMauritiusMexicoMicronesia, Fed. Sts.MoldovaMonacoMongoliaMontenegroMoroccoMozambiqueMyanmarNamibiaNauruNepalNetherlandsNew CaledoniaNew ZealandNicaraguaNigerNigeriaNorwayOmanPakistanPalauPanamaPapua New GuineaParaguayPeruPhilippinesPolandPortugalPuerto RicoQatarRomaniaRussian FederationRwandaSamoaSan MarinoSao Tome and PrincipeSaudi ArabiaSenegalSerbiaSeychellesSierra LeoneSingaporeSint Maarten (Dutch part)Slovak RepublicSloveniaSolomon IslandsSomaliaSouth AfricaSouth SudanSpainSri LankaSt. Kitts and NevisSt. LuciaSt. Vincent and the GrenadinesSudanSurinameSwazilandSwedenSwitzerlandSyrian Arab RepublicTajikistanTanzaniaThailandTimor-LesteTogoTongaTrinidad and TobagoTunisiaTurkeyTurkmenistanTuvaluUgandaUkraineUnited Arab EmiratesUnited KingdomUnited StatesUruguayUzbekistanVanuatuVenezuela, RBVietnamVirgin Islands (U.S.)West Bank and GazaYemen, Rep.ZambiaZimbabwe Timeline:
This timeline shows a graph from 1985 to 2015 of Isle of Man. No data until 1984. Number of actual observations by date: 31.
Source name:
World Development Indicators
Source organization:
World Bank national accounts data, and OECD National Accounts data files.
Categories, topics:
Economy & Growth
Last updated:
apr 23, 2017
Indicators value changes by year
Minimum:
188.849 mln
jan 1, 1985
Maximum:
4.514 bln
jan 1, 2015
At the date of observation
Value
Absolute change
Change from previous value
jan 1, 1985
188.849 mln
+188.849 mln
0.0%
jan 1, 1986
199.733 mln
+10.884 mln
5.76%
jan 1, 1987
243.059 mln
+43.326 mln
21.69%
jan 1, 1988
281.459 mln
+38.4 mln
15.8%
jan 1, 1989
328.72 mln
+47.261 mln
16.79%
jan 1, 1990
377.489 mln
+48.769 mln
14.84%
jan 1, 1991
428.885 mln
+51.396 mln
13.62%
jan 1, 1992
465.795 mln
+36.91 mln
8.61%
jan 1, 1993
487.093 mln
+21.298 mln
4.57%
jan 1, 1994
510.534 mln
+23.441 mln
4.81%
jan 1, 1995
544.449 mln
+33.915 mln
6.64%
jan 1, 1996
584.442 mln
+39.993 mln
7.35%
jan 1, 1997
645.619 mln
+61.177 mln
10.47%
jan 1, 1998
719.682 mln
+74.063 mln
11.47%
jan 1, 1999
836.338 mln
+116.656 mln
16.21%
jan 1, 2000
972.73 mln
+136.392 mln
16.31%
jan 1, 2001
1.058 bln
+85.404 mln
8.78%
jan 1, 2002
1.128 bln
+69.903 mln
6.61%
jan 1, 2003
1.229 bln
+101.375 mln
8.99%
jan 1, 2004
1.342 bln
+112.435 mln
9.15%
jan 1, 2005
1.496 bln
+153.949 mln
11.47%
jan 1, 2006
1.634 bln
+138.341 mln
9.25%
jan 1, 2007
1.818 bln
+183.501 mln
11.23%
jan 1, 2008
2.842 bln
+1.024 bln
56.35%
jan 1, 2009
3.17 bln
+328.286 mln
11.55%
jan 1, 2010
3.24 bln
+70.11 mln
2.21%
jan 1, 2011
3.508 bln
+267.648 mln
8.26%
jan 1, 2012
3.786 bln
+278.173 mln
7.93%
jan 1, 2013
4.072 bln
+286.241 mln
7.56%
jan 1, 2014
4.321 bln
+248.43 mln
6.1%
jan 1, 2015
4.514 bln
+193.421 mln
4.48%
Ranking of countries by current statistics by years


Comments: